SCADA Software
ATSCADA Graphic Tools for SCADA Interface Design and Industrial Visualization
ATSCADA Graphic Tools System (iGraphic & iSymbolFactory) This is a toolset designed to create professional and intuitive Windows Forms Applications interfaces with ATSCADA Graphic Tools.
iGraphicTools
An integrated library of components that helps display data more visually with ATSCADA Graphic Tools.
To use iGraphicTools, add the iGraphicTools library to Visual Studio.
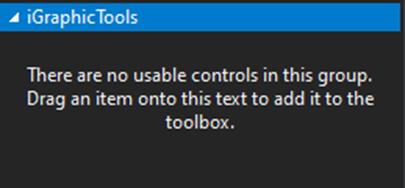
In the View Toolbox interface, create a new tab named iGraphicTools to easily manage all components included in ATSCADA Graphic Tools.
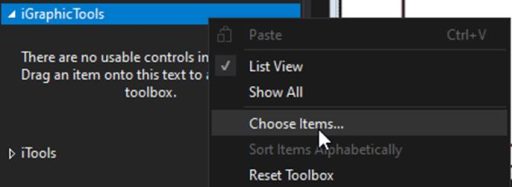
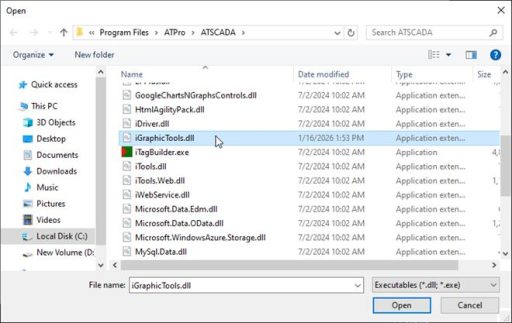
Right-click the newly created tab, then select Choose Item to add the iGraphicTools library for ATSCADA Graphic Tools.
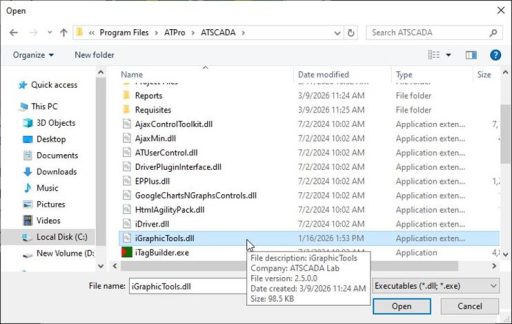
Select iGraphicTools.dll to proceed with adding the library.
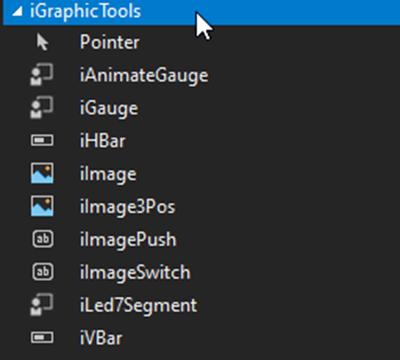
After successfully adding the components, you will see them in the iGraphicTools suite.
A project that provides detailed guidance on using the components of ATSCADA Graphic Tools:
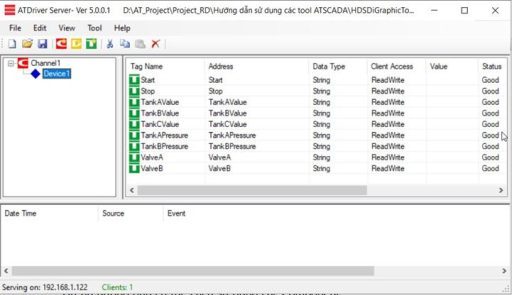
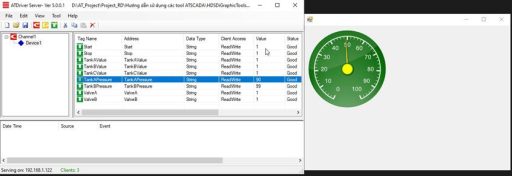
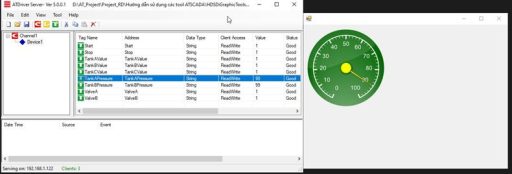
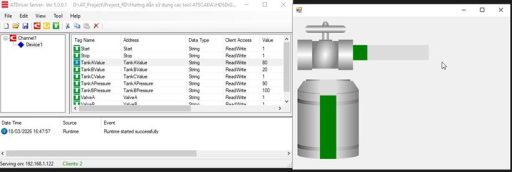
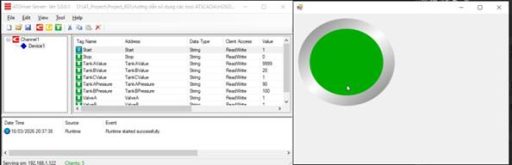
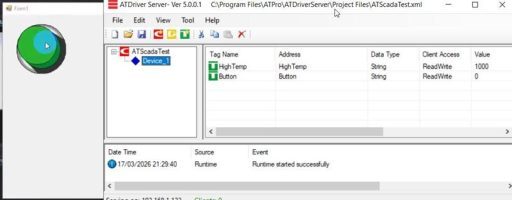
Step 1: Create a new ATDriverServer file with tags as shown in the image.
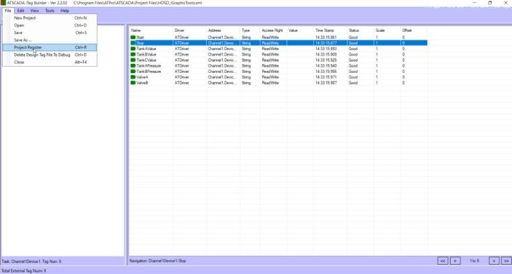
Guide 2: Register the Tag File with iTagBuilder for ATSCADA Graphic Tools.
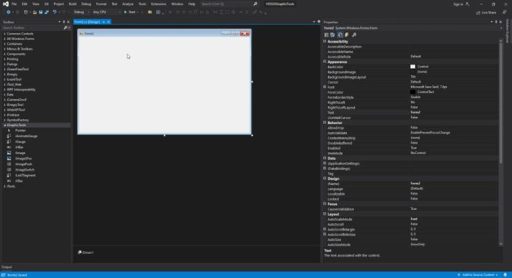
Step 3: Create a Windows Forms Application project.
Step 4: Drag the components from the newly added iGraphicTools library in ATSCADA Graphic Tools.
1. iAnimateGauge: Used to visualize real-time sensor values with a gauge display in ATSCADA Graphic Tools.
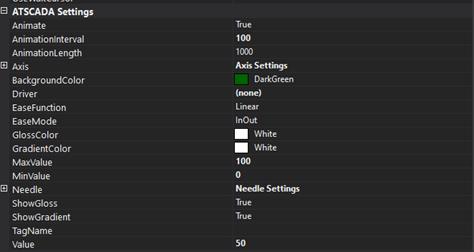
It includes the following properties:
- AnimationInterval: The movement interval of the gauge needle.
- AnimationLength: The total movement time between two different values.
- Axis: Used to adjust the gauge color.
- Value: The initial value displayed on the gauge.
Example: Change the Tag value from 0 to 80.
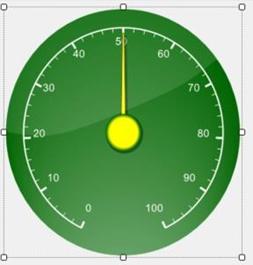
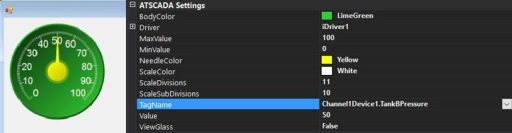
2. iGauge: Used to visualize real-time sensor values with a gauge display in ATSCADA Graphic Tools.

It includes the following properties in ATSCADA Graphic Tools:
ScaleSubDivisions: The total number of values displayed on the gauge face for better data visualization.
For example, if it is set to 11 as shown, the gauge range will display from 0 to 100.
ScaleDivisions: The total number of minor tick marks displayed between values on the gauge.
For example, from 0 to 10, there will be 10 minor tick marks.
Value: The initial value displayed on the gauge when loaded in ATSCADA Graphic Tools.
Example: Change the Tag value from 0 to 100.
Important Note: The key difference between iAnimateGauge and iGauge in ATSCADA Graphic Tools is the needle movement effect. iAnimateGauge provides smooth animated transitions when sensor values change, allowing the needle to move gradually between values for a more realistic display. In contrast, iGauge updates instantly and points directly to the new value without animation, making it ideal for fast real-time monitoring in industrial visualization systems.
3.iVBar & iHBar: Used to visualize real-time values with ATSCADA Graphic Tools and commonly deployed in ATSCADA iEnergy monitoring systems for power and utility dashboards
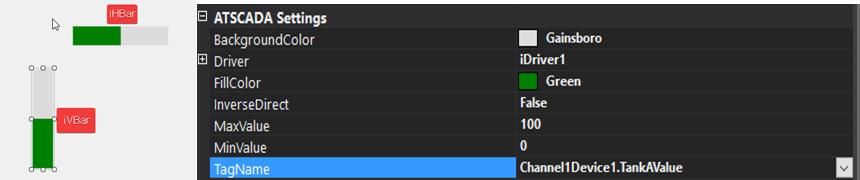
It includes the following properties in ATSCADA Graphic Tools:
- FillColor: Displays the visual value of the Tag.
- MaxValue: The maximum value of the bar range.
- MinValue: The minimum value of the bar range.
Example: Apply iVBar and iHBar to a real image.
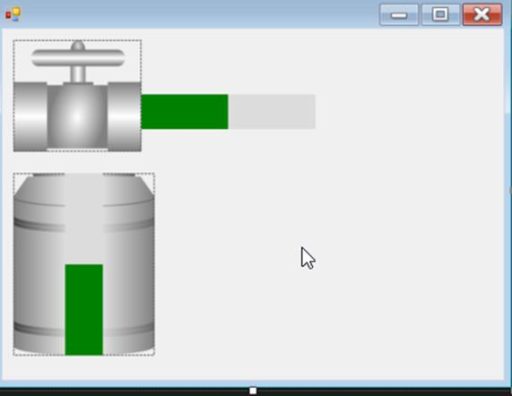
Try adjusting the iVBar value up to 80 and the iHBar down to 20:
4. iImage & iImagePos: The purpose is to illustrate real-world value using concrete images.
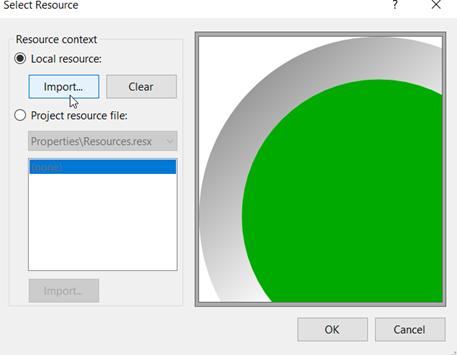
Example: Change the iImage display to another specific image by clicking the arrow in the top-left corner of the component in ATSCADA Graphic Tools.

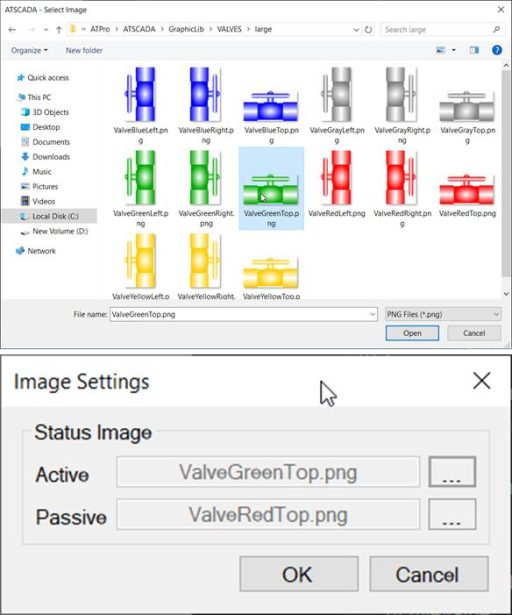
Click on Import to select images from the available list in the iGraphic library.
The image interface for iImage is located at: C:\Program Files\ATPro\ATSCADA\GraphicLib
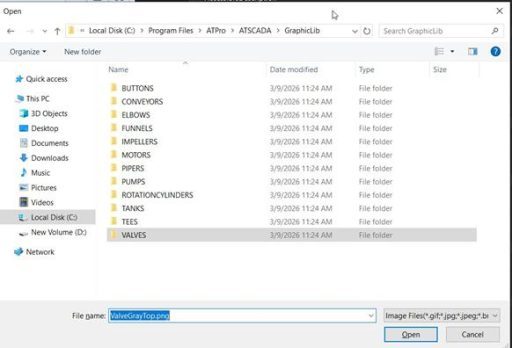
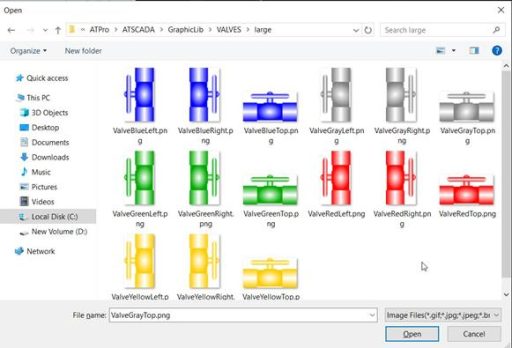
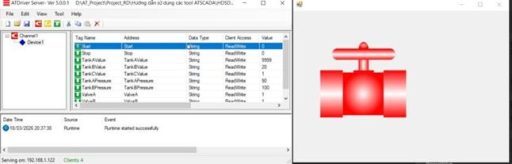
In this demo, we select VALVES and choose any water valve image we like.
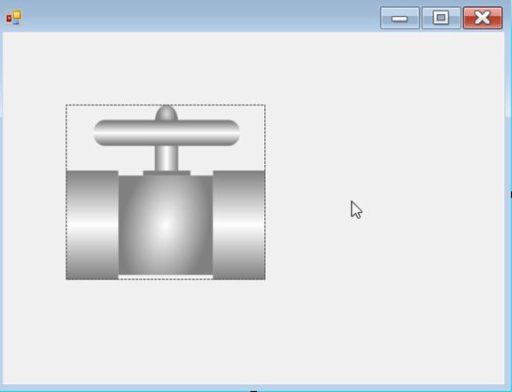
After the change
We configure the value as follows
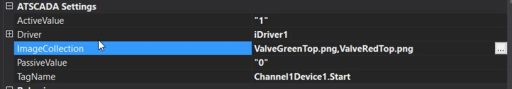
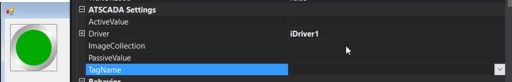
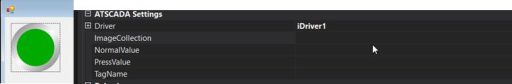
Here, configure the ImageCollection in advance to represent the pump status corresponding to the TagName value in ATSCADA Graphic Tools.
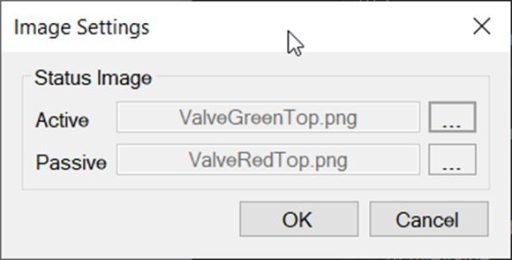
Configure the Active state with an image such as green, blue, etc. in ATSCADA Graphic Tools.
Configure the Passive state with an image such as red, gray, etc. in ATSCADA Graphic Tools.
- ActiveValue: “1” => If the TagName value is 1, it will switch to the image assigned in ImageCollection.
- PassiveValue: “0” => If the TagName value is 0, it will switch to the image assigned in ImageCollection.
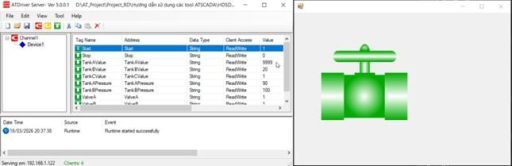
After configuration, the initial pump image will change to the color assigned to Passive in ATSCADA Graphic Tools.
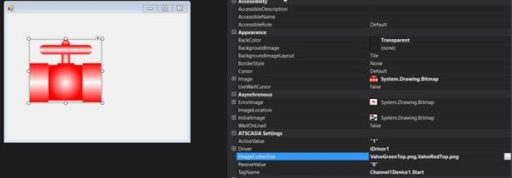
Upon testing, the TagName value is currently 0, so the pump image displays the PassiveValue from ImageCollection.
Change the value to 1 to match the ActiveValue value.
Important Note: In ActiveValue and PassiveValue, users can assign a TagName to read its value or set a fixed value by entering the value in quotation marks (“”) in ATSCADA Graphic Tools.
5.iImagePush & iImageSwitch: The purpose is to manipulate the TagName value through a press or a toggle (switch) action, often combined with ATSCADA authentication user account management secure SCADA controls for authorized operations.
Example:
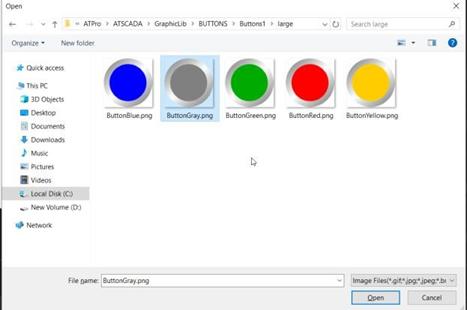
Change the image of the component to a different specific image by clicking the arrow in the left corner of the component.
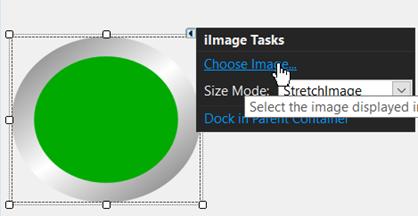
Click on Import to select images from the available list in the iGraphic library.

The image interface for iImage is located at: C:\Program Files\ATPro\ATSCADA\GraphicLib
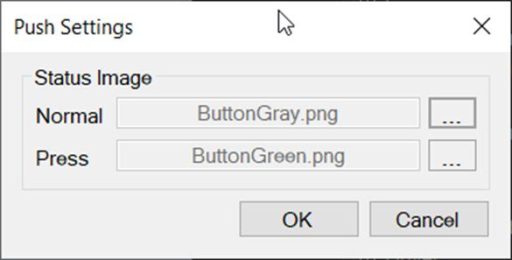
We configure the value as follows
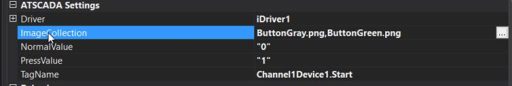
Here, we configure the ImageCollection beforehand to represent the state of the Button/Switch corresponding to the TagName value.
Upon testing, the TagName value is currently 0, so the pump image displays a Normal image in the ImageCollection.
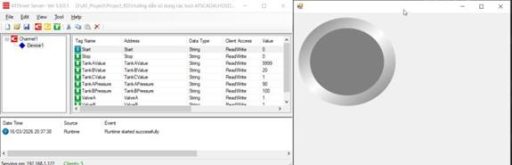
Press and hold the button to see the change.
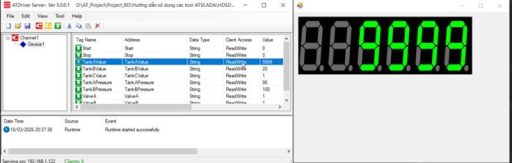
6. iLed7Segment: The purpose is to illustrate the value of TagName through the LED interface.
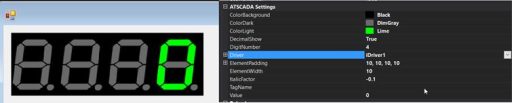
It includes important properties in ATSCADA Graphic Tools:
DecimalShow: Displays the maximum number of LED characters.
iTalicFactor: Adjusts the tilt angle of the LED text.
Example: Change the Tag value from 0 to 9999.
iSymbolFactoryTools:
A library with thousands of industrial icons (pumps, valves, tanks, etc.) to help design dynamic interfaces. iGraphic:
File path: C:\Program Files\ATPro\ATSCADA
iSymbolFactory:
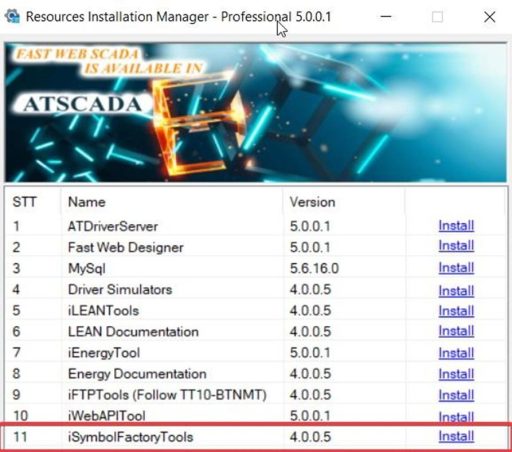
A library with thousands of industrial symbols (pumps, valves, tanks, etc.) that helps create dynamic interfaces with ATSCADA Graphic Tools.
To use iSymbolFactory, install the iSymbolFactory library through the Resources Installation Manager package.
After successful installation, add the iSymbolFactory.dll library to Visual Studio for use:
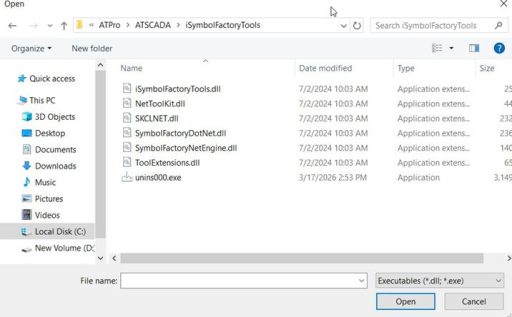
Library path:
C:\Program Files\ATPro\ATSCADA\iSymbolFactoryTools
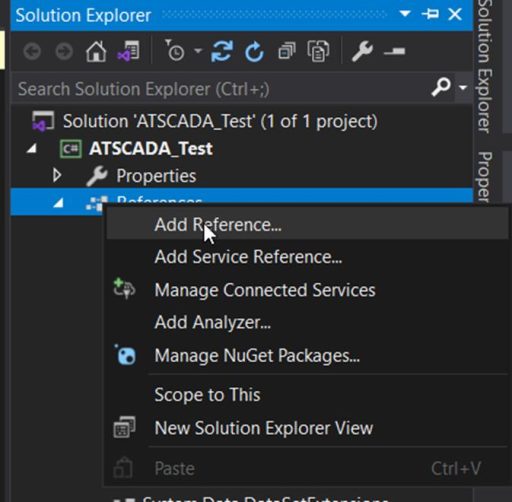
Then you need to add the relevant references to be able to use iSymbolFactoryTools
Select the 4 library files as shown in the image.
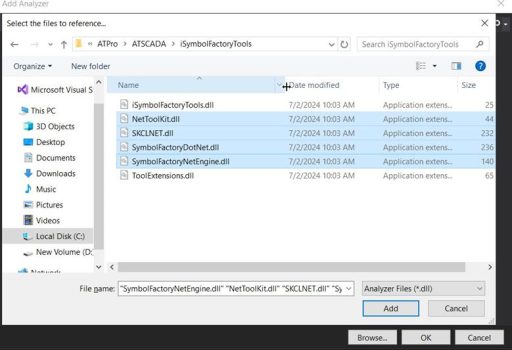
File path: C:\Program Files\ATPro\ATSCADA\iSymbolFactoryTools
Example usage:
We drag the iSymbolFactory component onto the Form:
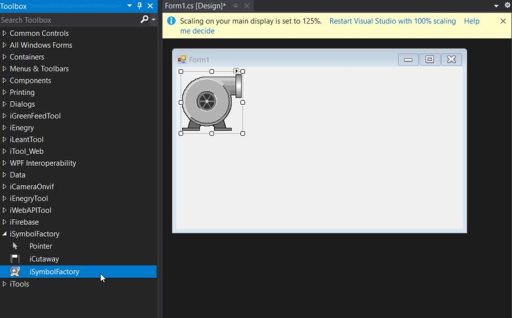
Click the arrow in the upper left corner of the component to change the image or object in the iSymbolFactory library.
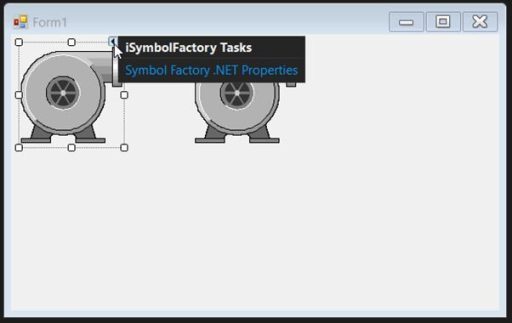
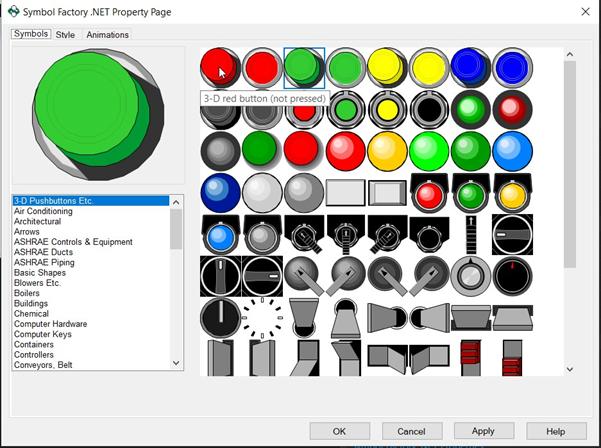
List of images included in the iSymbolFactory library:
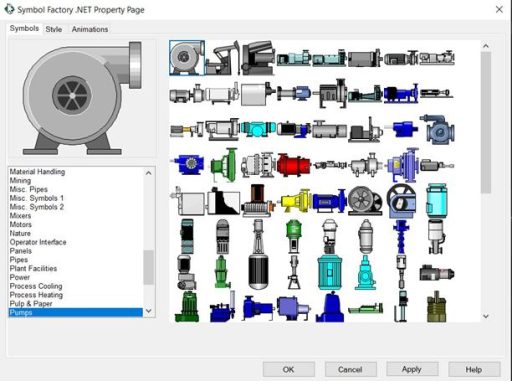
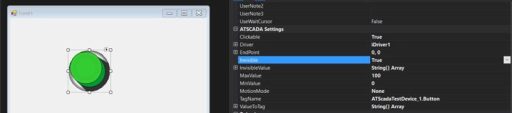
In this demo, we’ve chosen an image to illustrate pressing the button to write a value to the ATDriverServer tag.
The configuration is as follows:
Clickable: True, allows interaction with the button in ATSCADA Graphic Tools.
Invisible: True, hides the button when the Value equals InvisibleValue during operation.
InvisibleValue: Sets the value that will hide the button.
ValueToTag: Sets the value to be written when interacting with the button.
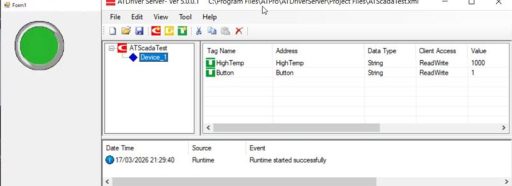
Test run
When the button is pressed, it immediately disappears and another button is displayed behind it, illustrating that the button is being pressed down. Simultaneously, the Tag Button value in ATDriverServer updates to 1.
You can find more illustrative examples for better understanding through videos on the ATSCADA homepage:
https://atscada.com/scada-symbols-factory/ (ATSCADA ISYMBOLFACTORY TOOLS)
👉 Learn More about ATSCADA Software


ATSCADA - Smart SCADA Software with AI Predictor & Blockchain. ATSCADA is an advanced SCADA software platform for real-time monitoring, intelligent control, and efficient data acquisition. It is ideal for Industrial IoT (IIoT), smart cities, integrated automation systems, and Agriculture 4.0. With a built-in AI Predictor, ATSCADA enables predictive analytics to detect issues early, optimize performance, and reduce downtime. The integration of Blockchain technology ensures secure, transparent, and tamper-proof data management. Highly scalable and easy to integrate, ATSCADA is trusted by businesses to enhance productivity, strengthen cybersecurity, and accelerate digital transformation.
Bài viết liên quan
ATSCADA AI Predictor Application for Time Series Data Forecasting
Introduction ATSCADA AI Predictor is an artificial intelligence application used for forecasting time series data [...]
Apr
ATSCADA Mobile Alarm Application for SCADA Alerts
The ATSCADA Mobile Alarm Application is a smart mobile solution developed by ATSCADA Lab, designed [...]
Apr
ATSCADA Fastweb -Industrial Web SCADA Applications
iWebService Tool The iWebService tool is a software component developed by ATSCADA Lab, operating in [...]
Apr
ATSCADA IExcelPouringTools – Smart Excel Pouring Data Management for Industrial Automation
ATSCADA IExcelPouringTools is a powerful toolkit designed to generate Excel reports from pre-built templates without [...]
Apr
ATSCADA IWebAPI Tools – Web API Integration Tools for Modern SCADA Systems
The ATSCADA IWebAPI toolset is designed to retrieve data from ATDriver Server and expose it [...]
Apr
ATSCADA IFTP – Advanced FTP File Transfer Tools for Industrial SCADA Systems
ATSCADA IFTP is a specialized FTP communication toolkit designed for industrial automation and environmental monitoring [...]
Apr