SCADA Software
ATSCADA Fastweb -Industrial Web SCADA Applications
iWebService Tool
The iWebService tool is a software component developed by ATSCADA Lab, operating in the application layer (ATSCADA Applications) and directly interacting with iDriver to process data and send data to Web Applications through ATSCADA iWebAPI tools web API integration methods.
Part 1: System Preparation and Installation
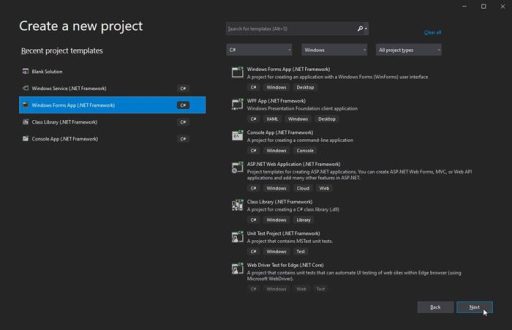
Step 1: Create a New Windows Forms App (.NET Framework) Project
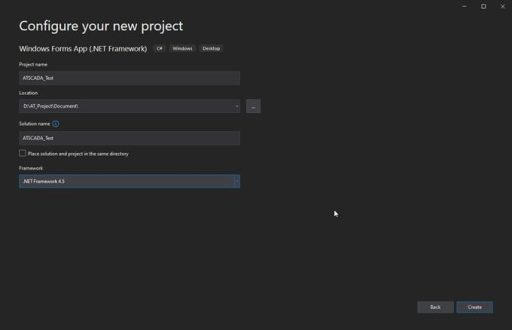
Name your project and select the framework as .NET Framework 4.5.
Step 2: Add the iWebService Library to the Toolbox
In the Toolbox panel, right-click and select Add Tab, then name it ATSCADA iWebService.
Right-click the newly created tab and select Choose Items…. Click Browse, then navigate to the installation path:
C:\Program Files\ATPro\ATSCADA\iWebService.dll
Click OK. The tool icon will appear in the Toolbox.
Note: When running iWebService, the application must be launched with Run as Administrator privileges.
Introduction to the Fastweb Designer Tool
This tool helps create professional and intuitive Web Application interfaces quickly without requiring programming knowledge (no-code).
Part 1: System Preparation and Installation
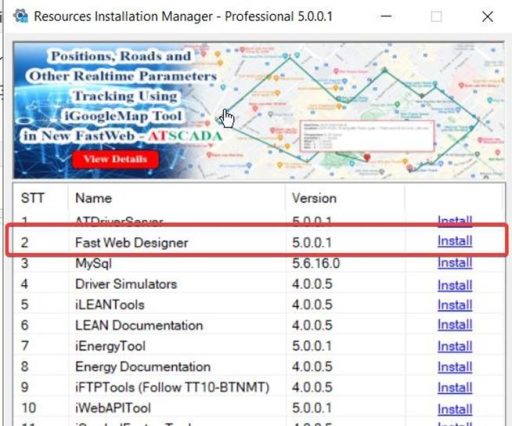
Install the Fastweb Designer Package
- Open the Resources Installation Manager software.
- Find Fastweb Designer (Version 5.0.0.1).
- Click the Install button.
- When the Setup window appears, click Install → Finish to complete the installation.
Overview of the Fastweb Designer Interface
The software interface is divided into 5 main areas, structured from top to bottom and from left to right:
Menu Bar – Top Section
This area contains all system control commands, divided into 3 main groups:
- File:
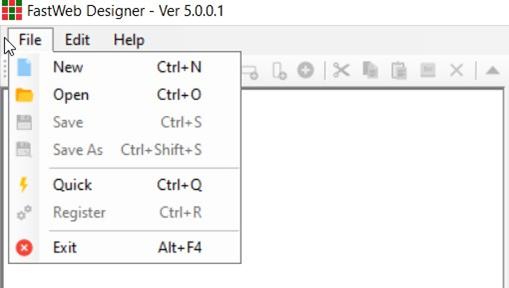
- New (Ctrl+N): Create a new project.
- Open (Ctrl+O): Open an existing project (.xml file).
- Save / Save As: Save the design configuration.
- Quick (Ctrl+Q): Automatically create a sample project based on existing Tags in Tag Builder.
- Register (Ctrl+R): The most important command used to publish the design configuration to the web runtime folder.
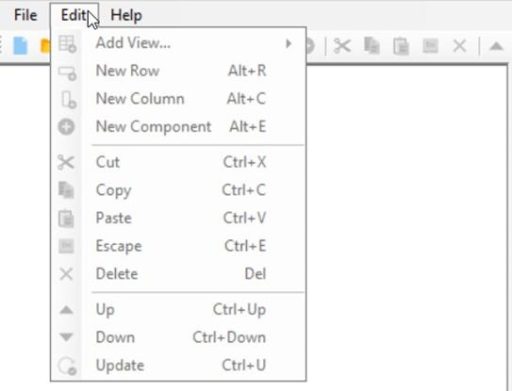
Edit: Contains object editing commands such as adding new items (View, Row, Column, Component), deleting (Delete), copying (Copy/Paste), and changing order (Up/Down).
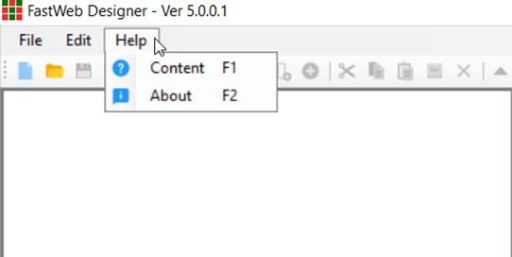
Help: View online instructions and version information.
Toolbar – Below the Menu Bar
Contains icons that allow quick mouse operations without accessing the Menu:
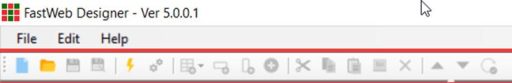
- Blank page icon: New Project.
- Folder icon: Open Project.
- Floppy disk icon: Save.
- Red lightning icon (Register): Register the project (deploy the design for actual use).
- Green plus icon: Quickly add a View, Row, or Column depending on the selected position.
- Up/Down arrow icon: Change the display order of pages or components on the web.
Object Tree Structure (Tree View) – Left Panel
This is the area used to manage the logical structure of the website in a parent-child hierarchy.
You will clearly see 5 levels:
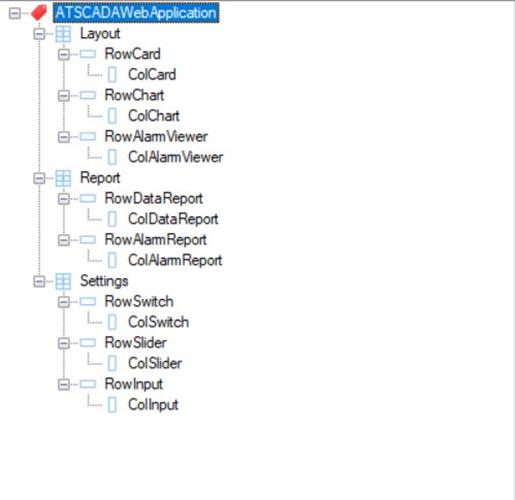
- Application (App Level): The root of the entire website.
- View (Page Level): Each subpage of the website (for example: Home, Reports, Settings).
- Row (Row Level): Divides the webpage horizontally.
- Column (Column Level): Divides a row into smaller sections using the Grid system (12 columns).
- Component (Object Level): Actual buttons, charts, and data tables.
- Mouse Operation: Click the + sign to expand, or click directly on the name to view the child list on the right side.
Detailed List (List View) – Main Right Panel
When you select an object in the left panel, the detailed information of its child objects will be displayed here:
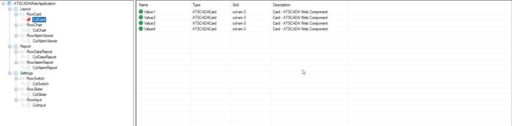
- Name: Identifier name of the object.
- Type: Object type (for example: ATSCADARow, ATSCADAColumn, iCard, iChart).
- Grid: Displays column division parameters based on the Bootstrap standard (for example: col-sm-3, col-sm-6).
- Description: Short description of the object.
- Mouse Operation: Double-click a row here to open the properties panel (Editor) and edit technical parameters (Tag name, color, size…).
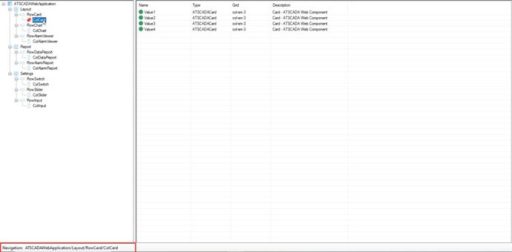
Navigation Path – Bottom Section
Displays the “location path” of the currently selected object to avoid confusion when designing large projects.
- Example: NewApplication/Layout/Row1/Column1/Value1. It helps you clearly identify which Component you are editing, which column it belongs to, and which page it is located on.
Components in Fastweb Designer
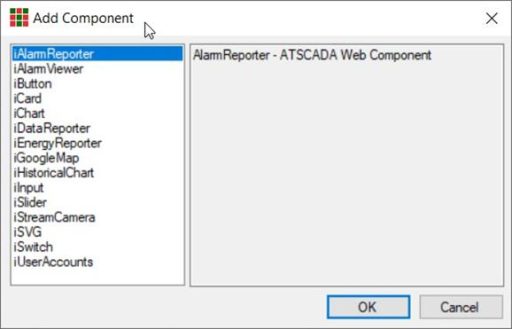
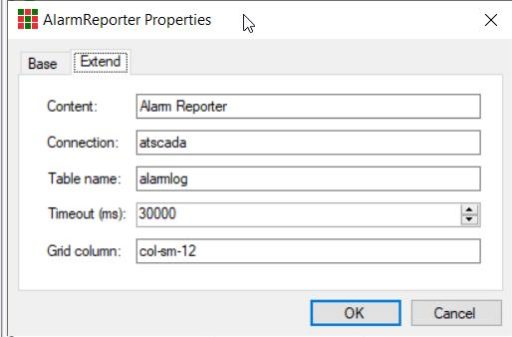
iAlarmReporter
- Description: A component that helps users export reports from data stored in the database, with automation options through ATSCADA iExcelPouring smart Excel report automation.
- Usage:
- Content: Enter the label name (for example: “Furnace 1 Temperature Report”).
- Connection: Name of the database connection string.
- TableName: Name of the data table used for report export.
- GridColumn: Width of the component displayed on the web.
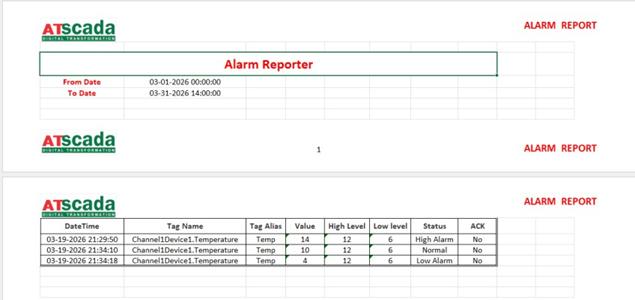
Results:
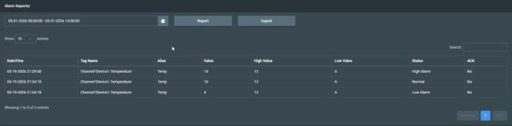
You can export the report to an Excel file using the Export button:
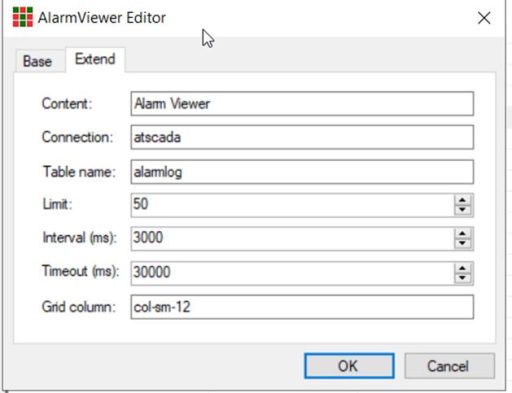
iAlarmViewer
- Description: A component that helps users quickly view Alarm data stored in the database.
- Usage:
- Content: Enter the label name (for example: “Area 1”).
- Connection: Name of the database connection string.
- TableName: Name of the data table used for report export.
- GridColumn: Width of the component displayed on the web.
- Limit: Limit the number of records to display.
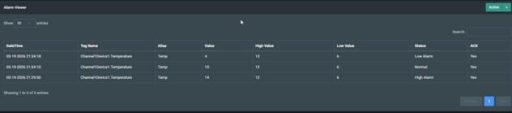
Results:
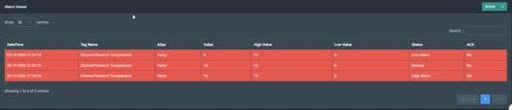
Here you can use the Acknowledge function to mark these alarms as having been reviewed.
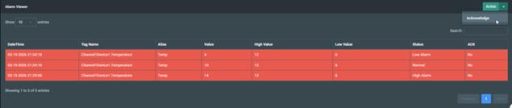
When you click on it, all notifications will return to normal.
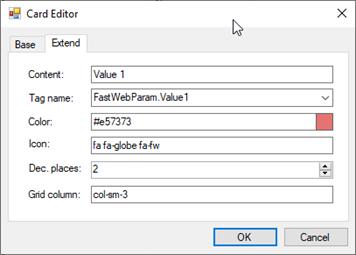
iCard
- Description: A component used to display the value of a TagName.
- Usage:
- Content: Enter the label name (for example: “Area 1 Temperature”).
- TagName: Assign the TagName to be used.
- Icon: Display the descriptive icon of the card.
- Dec. Places: Number of decimal places for the displayed value.
Results:
![]()
- Change Icon:
To change the icon displayed in iCard, go to W3Schools Icons.
https://www.w3schools.com/icons/
Here, select the icon you want to display, copy it, and paste it into the Icon property of iCard.
- Example:
Change the icon from globe to cloud.
![]()
Results:
![]()
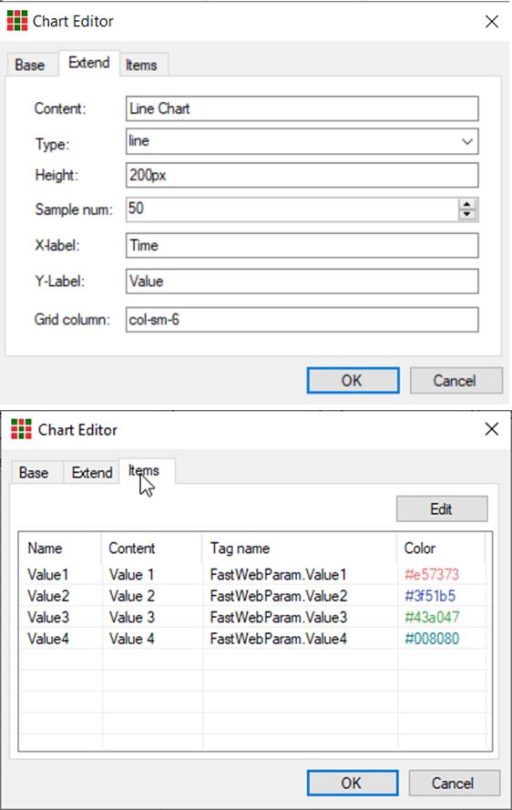
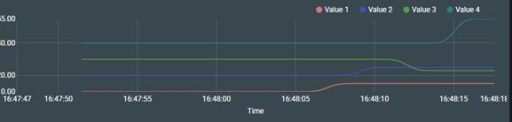
iChart
- Description: A component that supports displaying TagName values in chart format.
- Usage:
- Content: Enter the label name (for example: “Area 1 Temperature”).
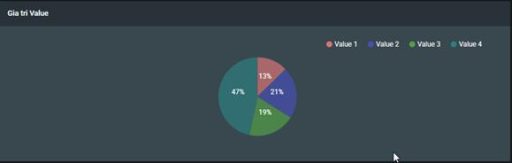
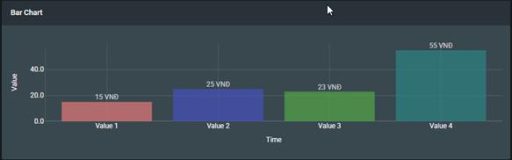
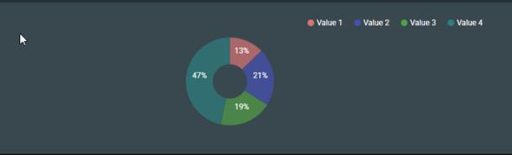
- Type: Chart type including Line, Bar, Pie, Donut depending on the usage purpose.
- Tab Items: Assign the values to be displayed on the chart.
Results:
Line Chart:
Pie chart:
Bar Chart:
Donut:
iHistoricalChart
- Description: A component that allows users to review historical data in chart form.
- Usage:
- Content: Enter the label name (for example: “Temperature History 1”).
- Connection: Select the name of the ConnectionString.
- Type: Select the chart type to display.
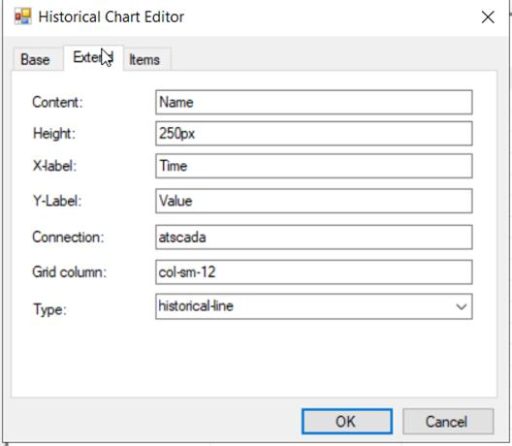
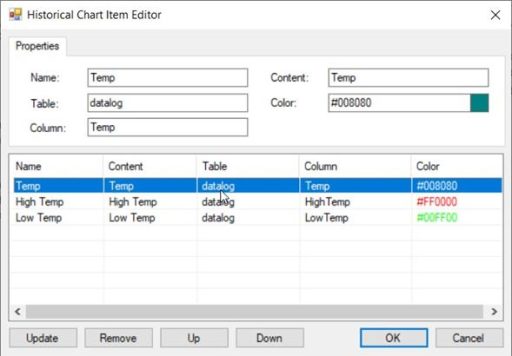
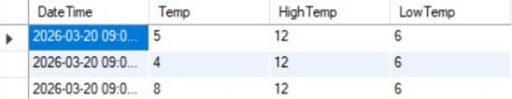
Note: The table name must match the table name in MySQL.

The Column section must match the column names in MySQL.
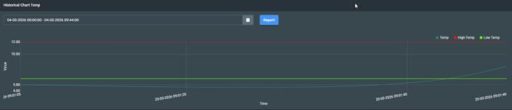
Results:
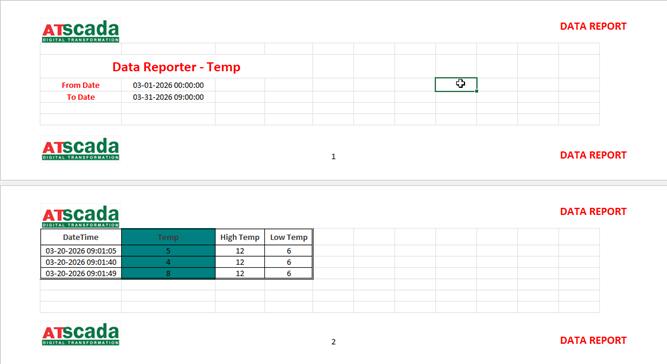
iDataReporter
- Description: A component that helps users export reports from data stored in the database.
- Usage:
- Content: Enter the label name (for example: “Temperature Report 1”).
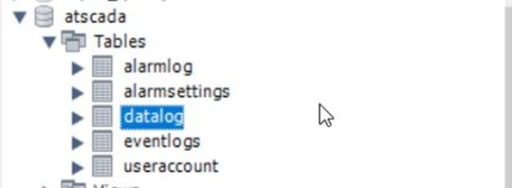
- Connection: Select the name of the ConnectionString.
- TableName: Name of the table used for report export.
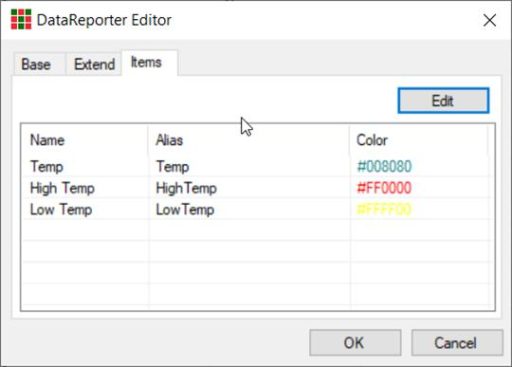
- Tab Items: Assign the values to be displayed and included in the report.
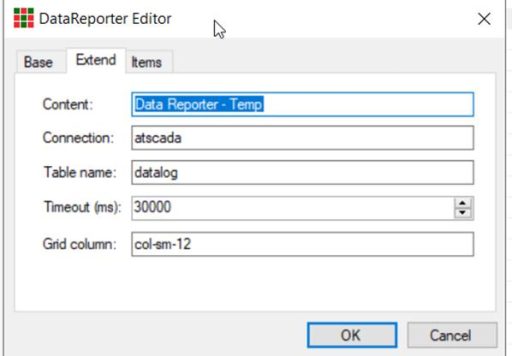
Note: The table name must match the table name in MySQL.
The Name section is the name displayed on the Web.
The Alias section must match the column in MySQL.
Results:
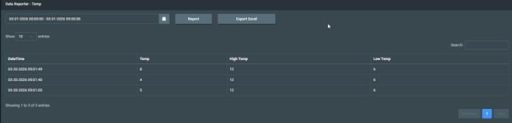
Can be exported to Excel file:
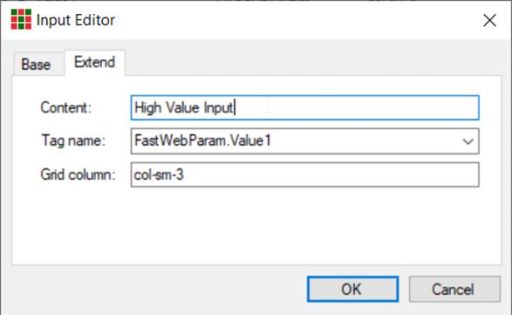
iInput
- Description: A component that allows users to input any value to a TagName.
- Usage:
- Content: Enter the label name (for example: “High Value Input”).
- TagName: Select the TagName to be operated.
Results:
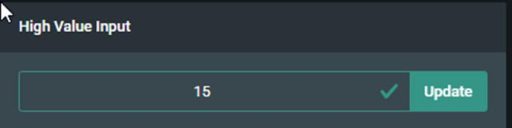
Try entering a new value and click Update => The value will be updated to the assigned TagName.

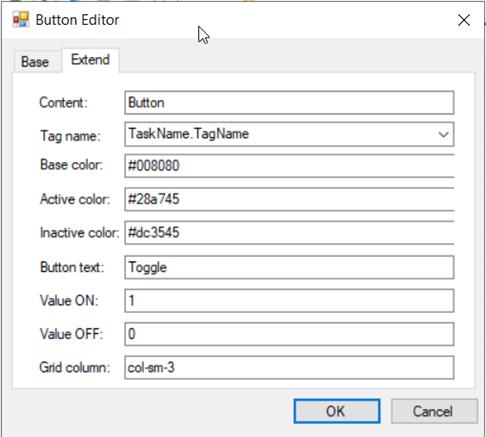
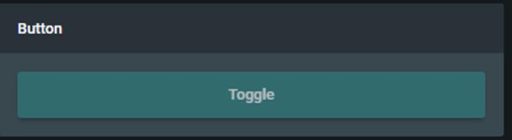
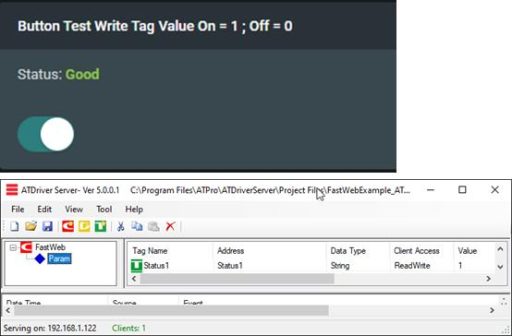
iButton
- Description: A component that allows users to control a TagName using two specific values, such as 1 or 0.
- Usage:
- Content: Enter the label name.
- TagName: Assign the TagName to be controlled.
- ActiveColor: Button color when the value is ON.
- InactiveColor: Button color when the value is OFF.
- ButtonText: Display text of the button.
- ValueOn: This value will be written to the TagName when activated.
- ValueOff: This value will be written to the TagName when deactivated.
Results:
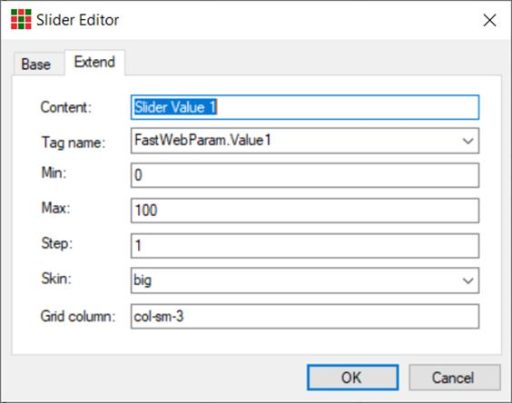
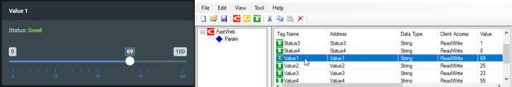
iSlider
- Description: A component that helps users quickly input and control values within a predefined range.
- Usage:
- Content: Enter the label name (for example: “Slider Value 1”).
- TagName: Select the TagName to be operated.
Results:
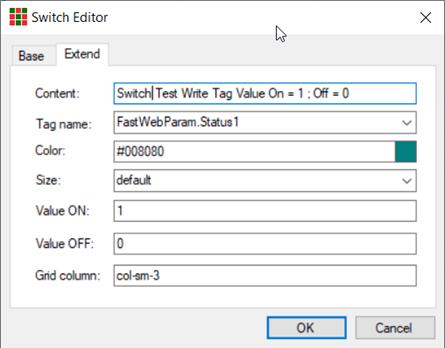
iSwitch
- Description: A component that helps users quickly control preset values.
- Usage:
- Content: Enter the label name.
- TagName: Select the TagName to be operated.
Results:
Try manipulating the switch to change the Status from 1 to 0.
Result:
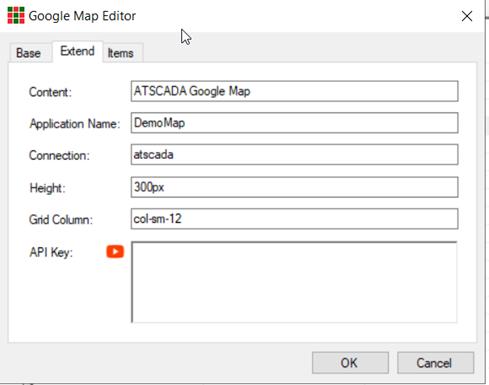
iGooglemap
- Description: A component that allows users to embed Google Maps to indicate the location of a business or factory.
- Usage:
- Content: Enter the label name (for example: “Factory Map”).
- API Key: Enter the Google API Key here.
Items Tab: Configure detailed information about the locations displayed on Maps.
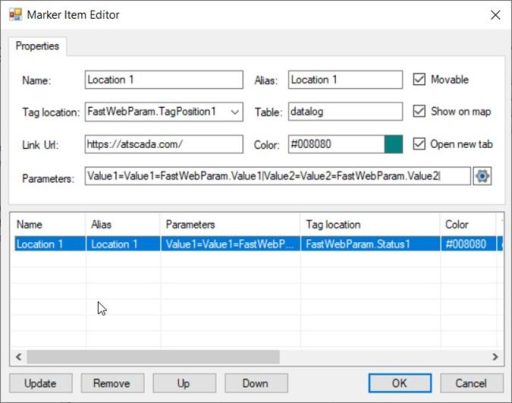
Name: Enter the name to be displayed on the map.
Table: Select the table in MySQL.
Link URL: Specify the link when clicking this location.
Parameters: Display values such as Temp, Humi, V…
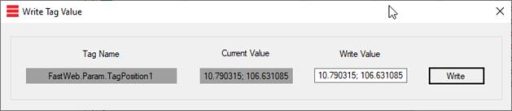
Tag Location: Select the tag containing the coordinate values on Google Maps. To obtain coordinates, follow these steps:
1. Access Google Maps.
2. Select the location to be displayed, and the coordinate position will appear (circled section).

3. Copy this value and enter it into the Value of TagPosition.
Note: Google Maps coordinates are separated by a comma (,). They must be changed to a semicolon (;).
Results: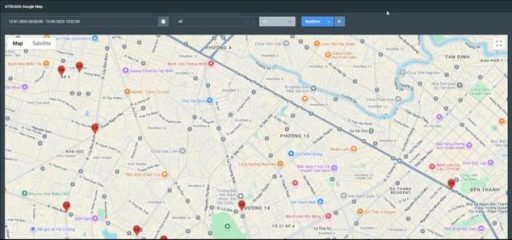
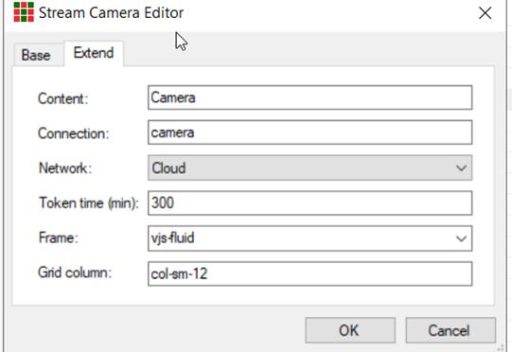
iStreamCamera
- Description: A component that allows users to connect to a camera for web streaming.
- Usage:
- Content: Enter the name.
- Network: Select Cloud to get the stream from Cloud, or Onviff to connect to the camera via the Onviff standard.
Results:

iSVG
- Description: A component that allows users to embed SVG images to visually represent factory or business processes.
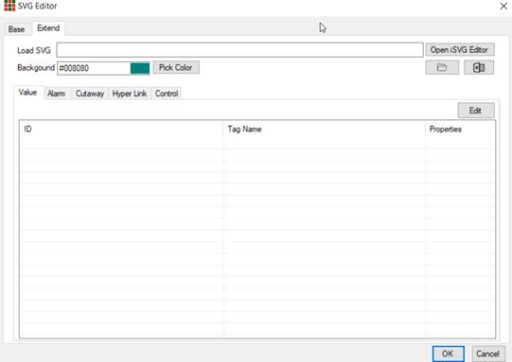
- Usage:
- First, prepare an SVG file (it can be created using Inkscape software).
- Load SVG: Open iSVG Editor to access the SVG working interface.
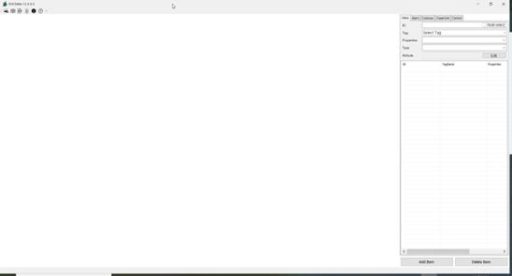
First, load the prepared SVG image by using the shortcut Ctrl + O → Select the prepared SVG file.
Proceed to assign display values or events in the right-hand tab.

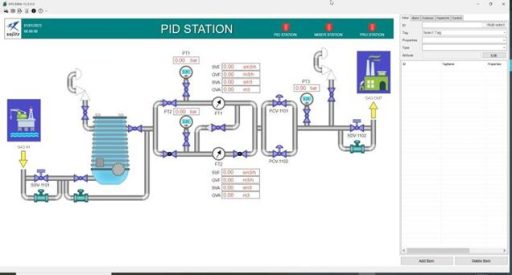
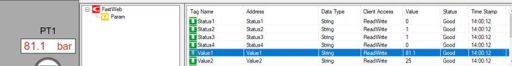
For example, you need to display the Tag Value1 at position PT1 in the SVG image.
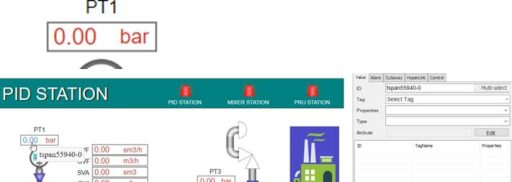
Select the desired display location, and the SVG tool will automatically extract that location from the SVG file and place it in the ID field.
Select the desired tag in the Tag field.
Results:
Essential iSVG Properties in ATSCADA Fastweb
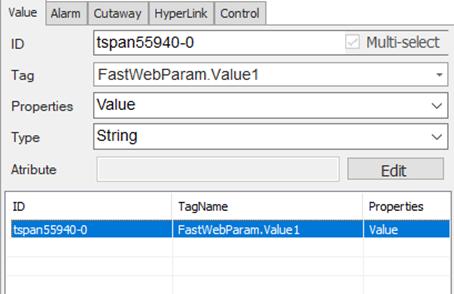
Value Property
- Function: Used to display the actual value of a tag (technical parameters such as temperature, pressure, etc.) on the web interface.
- Usage:
- Select an object on the SVG (for example: a text box).
- In the Value tab, choose the corresponding Tag from the server.
- Select Properties as Value.
- Choose the data type (default is usually String to display text/numbers).
- Click Add Item to save the configuration.
Status Property
- Function: Used to check and display the connection status of a Tag (good connection or disconnected).
- Usage:
- Select the display object (Text or shape).
- Text mode: Set the display content for Good status (for example: Connected) and Bad status (for example: Disconnected).
- Color mode: Set colors representing the status (for example: green for good, red for disconnected).
Animation Property
- Function: Changes the color of an object based on Tag value ranges.
- Usage:
- In the Value tab, select Properties as Animation.
- Choose Color (color change) or Blink (blinking).
- Click Edit Attribute to divide value ranges (Breakpoints). Example: 0-10 green, 10-20 red, 20-30 yellow.
Alarm Property
- Function: Creates a red blinking effect when the Tag value exceeds the high threshold or falls below the low threshold.
- Usage:
- Switch to the Alarm tab.
- Select the Tag to track.
- Select Tags containing threshold values (High and Low).
- When the actual value is outside the threshold range, the object on the web will automatically blink red as a warning.
Cut-Away Property
- Function: Commonly used to simulate water level in a tank or a progress bar.
- Usage:
- Requires 2 objects: Container (tank body) and Value (water/level display part).
- Set the minimum (Min) and maximum (Max) values.
- Configure colors for levels: Low, Normal, High. When the value changes, the displayed level rises or falls accordingly.
Hyperlink Property
- Function: Assigns a URL link to an object.
- Usage:
- Switch to the Hyperlink tab.
- Assign a Tag containing a website URL value (for example: GitHub link, report page link).
- When users click the object in the browser, the system opens the linked webpage.
Control Property
- Function: Allows users to interact with and change Tag values directly from the web interface.
- Usage: There are 2 main types:
- Switch: Used for On/Off (0/1) values. Click the object to toggle status (for example: turn pump on/off).
- Analog: When clicking the object, an input pop-up appears so users can enter a numeric value directly to the Tag.

Introduction to Fastweb Example and Specific Components in Fastweb Designer
Part 1: Fastweb Example Project Preparation
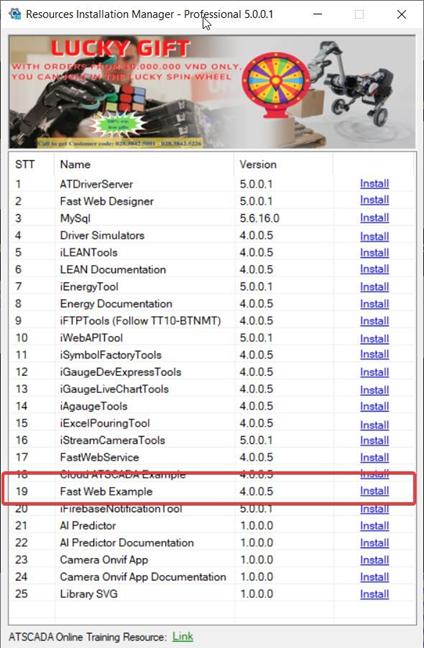
Step 1: Install the Fastweb Example Package
Open the Resources Installation Manager software. Find Fast Web Example (Version 4.0.0.5).
Click the Install button.
When the Setup window appears, click Install → Finish to complete the installation.
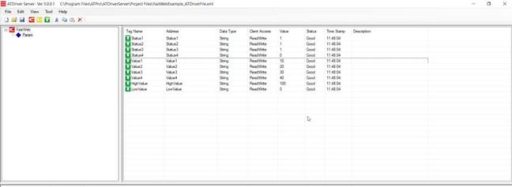
Step 2: Configure ATDriver Server (Create Data Tags)
This is a very important step to create the data “materials” for the calculation tools. The Fast Web Example package already includes an integrated ATDriverFile.
Open ATDriver Server. Go to Open →
C:\Program Files\ATPro\ATSCADA Examples\Fast Web Example\ATDriverFile → select FastWebExample_ATDriverFile.xml
Copy the file InternalMemoryTagFastWeb.txt into the folder:
C:\Program Files\ATPro\ATDriverServer\InternalMemory
When successful, the ATDriverServer software will be displayed.
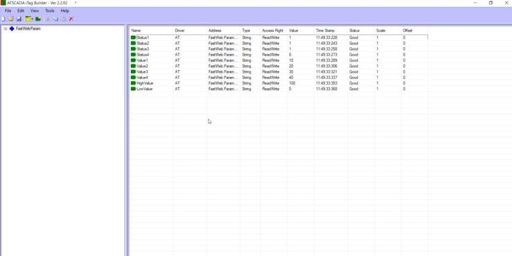
Step 3: Configure iTagBuilder
Open iTagBuilder. Select New → Yes.
In Driver Name, enter ATDriver. Click Add Driver, then select the file ATDriverClient.dll.
Enter the IP Address of the computer running Driver Server (for example: 192.168.1.122) or use the default localhost. Click Connect.
Go to Tools → Import All. Select Device and click OK.
Go to File → Project Register, save the file name, and click Yes to register the tags into the system.
Step 4: Configure WinForms to Send Data to Fastweb
Open Visual Studio → Create New Project → Windows Forms App → select .NET Framework 4.5 version.
In the Windows Forms App interface, drag the iWebService component.
Configure the Properties of iWebService:
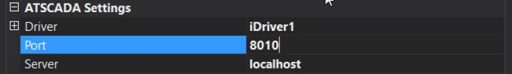
- Driver: Select iDriver1.
- Port: Set up a port for iWebService to operate.
- Server: Set up an IP address for iWebService to operate. If left as default localhost, it will use the IPv4 address of the computer running the software.
Click Start to run the software.
Note: For Fastweb to operate properly, the WinForms application containing iWebService must always remain running.
Step 5: Prepare the Web Server Configuration File
Go to the folder:
C:\Program Files\ATPro\FastWeb Designer\Template
This folder contains the standard Fastweb Template provided by ATSCADA. Copy this Template folder to another location to reuse the template.
For example: Create a new folder Fastweb Example on drive D: and copy it there:
D:\Fastweb Example
The Template folder structure will be as follows:
Root/
├── AppConfig/
├── ATSCADAWebConfig.xml
├── AppScripts/
├── AppTemplate/
├── bin/
├── Content/
├── Image/
├── ReportTemplate/
├── Views/
├── favicon.ico
├── Global.asax
└── Web.config
Copy the file ATSCADAWebConfig.xml from:
C:\Program Files\ATPro\ATSCADA Examples\Fast Web Example\Config
Paste it into the Template folder above to run Fastweb Example.
Step 6: Import the .sql file to retrieve the database.
Open the installed MySQL Workbench 6.0 CE.
![]()
In the toolbar, click on Server -> Import
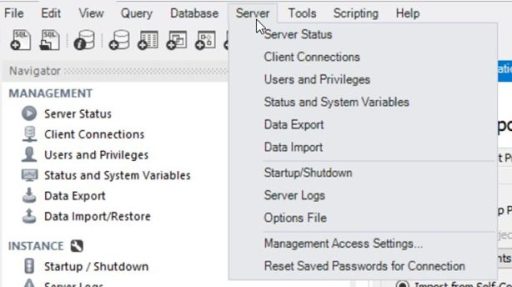
In the Import interface, select […] Import from Self-Contained File
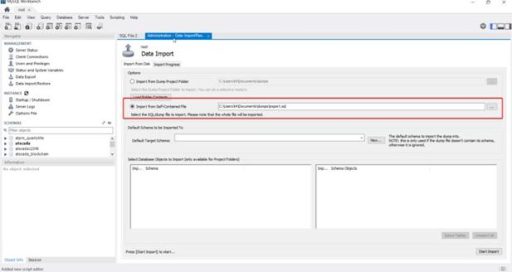
Navigate to the following folder:
C:\Program Files\ATPro\ATSCADA Examples\Fast Web Example\Database
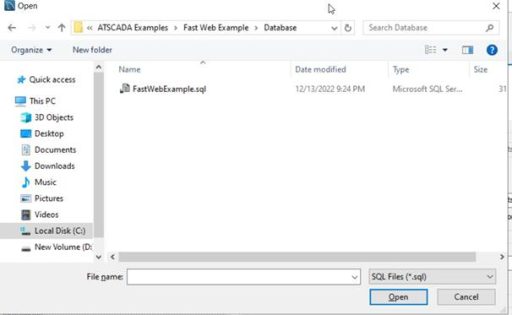
Select the FastWebExample.sql file and click Open.
Step 7: Configure IIS to deploy the web server
Open IIS => Sites => Add Website
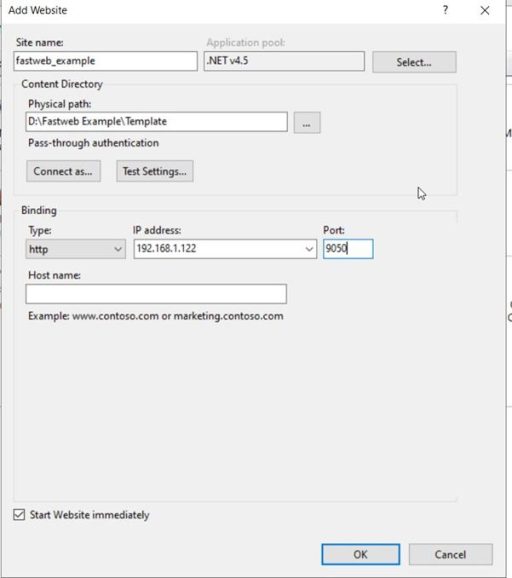
Physical path: Select the Template folder copied in step 5 to specify the Web Server folder.
IP Address: Select the computer’s IPv4 address or leave it as Localhost.
Port: 1 empty port in the IP address range.
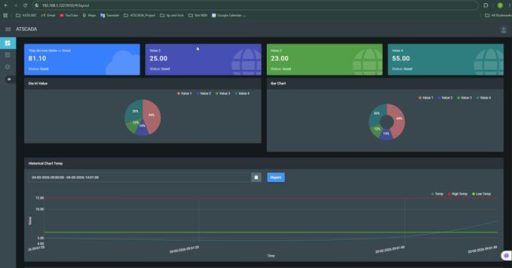
Step 8: Open your browser and access the configured IP address.
Open any browser and enter the IP address and port number configured in step 7 to access the Fastweb Example page:
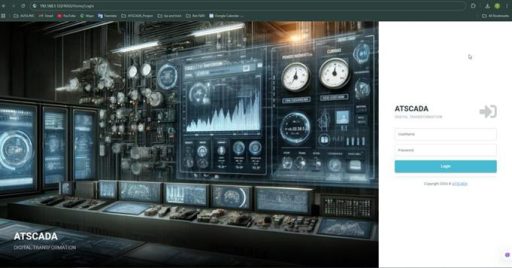
Username & Password: Obtained from registration using the iUserAccount tool.
👉 Learn More about ATSCADA Architecture

ATSCADA - Smart SCADA Software with AI Predictor & Blockchain. ATSCADA is an advanced SCADA software platform for real-time monitoring, intelligent control, and efficient data acquisition. It is ideal for Industrial IoT (IIoT), smart cities, integrated automation systems, and Agriculture 4.0. With a built-in AI Predictor, ATSCADA enables predictive analytics to detect issues early, optimize performance, and reduce downtime. The integration of Blockchain technology ensures secure, transparent, and tamper-proof data management. Highly scalable and easy to integrate, ATSCADA is trusted by businesses to enhance productivity, strengthen cybersecurity, and accelerate digital transformation.
Bài viết liên quan
ATSCADA AI Predictor Application for Time Series Data Forecasting
Introduction ATSCADA AI Predictor is an artificial intelligence application used for forecasting time series data [...]
Apr
ATSCADA Mobile Alarm Application for SCADA Alerts
The ATSCADA Mobile Alarm Application is a smart mobile solution developed by ATSCADA Lab, designed [...]
Apr
ATSCADA IExcelPouringTools – Smart Excel Pouring Data Management for Industrial Automation
ATSCADA IExcelPouringTools is a powerful toolkit designed to generate Excel reports from pre-built templates without [...]
Apr
ATSCADA IWebAPI Tools – Web API Integration Tools for Modern SCADA Systems
The ATSCADA IWebAPI toolset is designed to retrieve data from ATDriver Server and expose it [...]
Apr
ATSCADA IFTP – Advanced FTP File Transfer Tools for Industrial SCADA Systems
ATSCADA IFTP is a specialized FTP communication toolkit designed for industrial automation and environmental monitoring [...]
Apr
ATSCADA iEnergy– Smart Energy Monitoring and Management System
ATSCADA iEnergy Tools is an extension library (plugin) for the ATSCADA SCADA system, working alongside [...]
Apr