SCADA Software
ATSCADA AI Predictor Application for Time Series Data Forecasting
Introduction
ATSCADA AI Predictor is an artificial intelligence application used for forecasting time series data such as:
- Temperature, humidity
- Energy consumption (electricity, gas, water flow, etc.)
- Other sensor indicators
The system supports:
- Importing data from CSV files.
- Automatically detecting data frequency (seconds, minutes, hours, days).
- Short-term forecasting (next 15–90 steps).
- Comparing 3 models: LSTM, Transformer, Prophet.
- Exporting results to Excel with charts, CSV, or JSON.
- Saving cache to improve rerun speed.
Objective: Help users take early action to avoid risks across the entire system through predictive analytics and ATSCADA mobile alarm applications for instant notifications.
Benefits:
- Provide users with future data insights for a broader overview based on actual data.
- Enable earlier decision-making to minimize risks.
System Requirements
• Operating System: Windows 10/11 (64-bit)
• RAM: Minimum 8 GB (16 GB recommended for large datasets)
• Free Disk Space: At least 2 GB
• No need to install Python or any other libraries.
Main Interface
1. When opening the application for the first time, the license key input interface will be displayed:
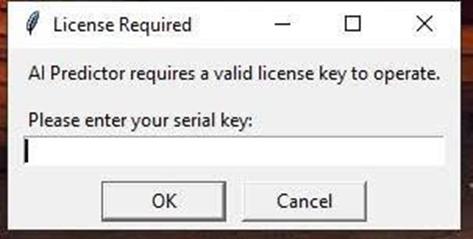
At this stage, please contact ATSCADA Lab to obtain a license key for using the software.
If the license key is entered successfully, the following notification will be displayed:
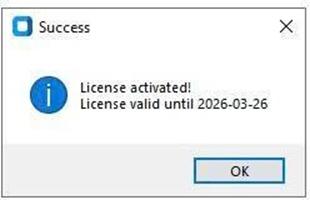
At this point, restart the software and use it normally.
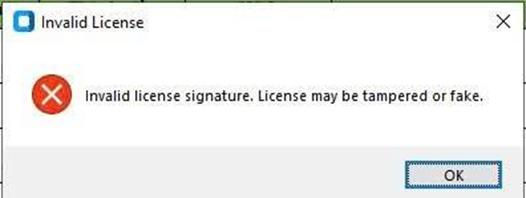
Note: When copying and pasting the license key into the license textbox, there may be an extra space at the end. If an extra space is included, an error may occur as shown below:
Once the license key is successfully activated, you will see the interface shown below:
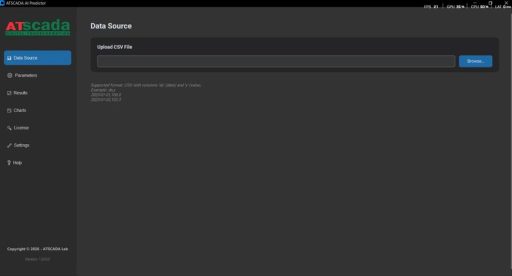
The menu includes 7 main tabs:
- Data Source: Select a file to analyze data and generate predictions.
- Parameters: Configure the forecast points for future prediction models.
- Results: View analysis results from the AI system and export reports.
- Charts: View results displayed in chart format.
- License: Check the remaining validity of the license for software usage.
- Settings: Configure system settings.
- Help: Quick access to the ATSCADA Lab page to read documentation in the browser.
Step-by-Step User Guide
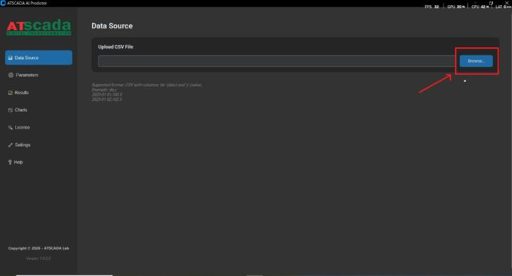
Step 1: Import Data (Data Source Tab)
Select Upload CSV File as shown below:
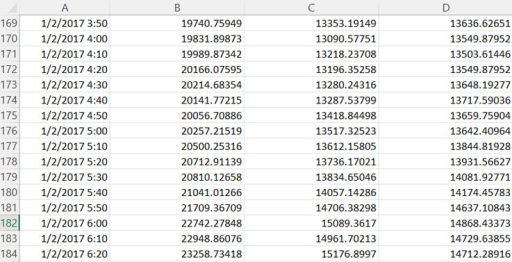
Select a file with the following format:
Column 1: Time (ISO 8601 format, e.g., 2025-11-01 00:00:01)
Columns 2 onwards: Numerical value (temperature, electricity consumption level, etc.)
Example:

Step 2: Set parameters (Tab “Parameters”)
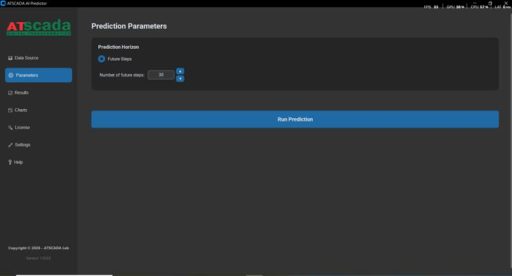
Future Steps: Specify the number of points the model needs to predict in the future (default is 30 points, maximum is 90 points).
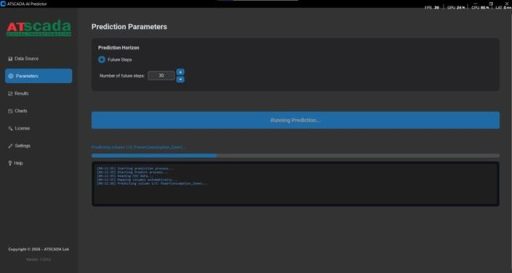
After selecting the future steps, click Run Prediction.
Step 3: View the results (Tab “Result”)
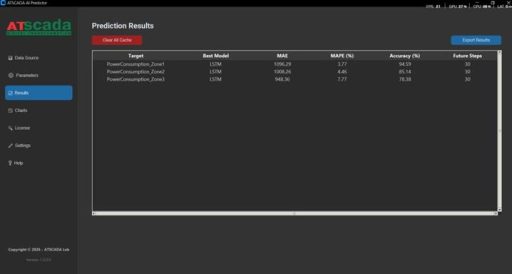
Target: The name of the data column detected by the system from the file selected in Step 1.
Best Model: The best model selected by the system to generate forecasting results.
MAE: Mean Absolute Error :
- Unit: Same as the input data unit (kWh, °C, etc.)
- Meaning: “On average, how many units does each prediction differ from the actual value?”
- Example: MAE = 120 vehicles/hour → The forecast differs by an average of 120 vehicles per hour from actual values.
- Lower MAE → Higher model accuracy.
- Advantage: Easy to understand and less affected by large outliers.
MAPE (%): Mean Absolute Percentage Error
- Unit: Percentage (%)
- Meaning: “On average, how much percentage does each forecast differ from the actual value?”
- Example: MAPE = 5% → The forecast differs by an average of 5% from the actual value.
- MAPE < 10% → Excellent
- MAPE 10–20% → Good
- MAPE > 50% → Poor
Accuracy (%): Accuracy
- Unit: Percentage (%)
- Meaning: “The closeness of the forecast to actual values, measured on a 0–100% scale.”
Example: MAPE = 8% → Accuracy = 92%
Higher Accuracy → More reliable model.
Industry Standards:
▪ > 90%: Excellent – can be used for decision-making.
▪ 80 – 90%: Good – requires further monitoring.
▪ < 80%: Data and model should be reviewed.
◦ Customers can use the Export Data function to export this report file:
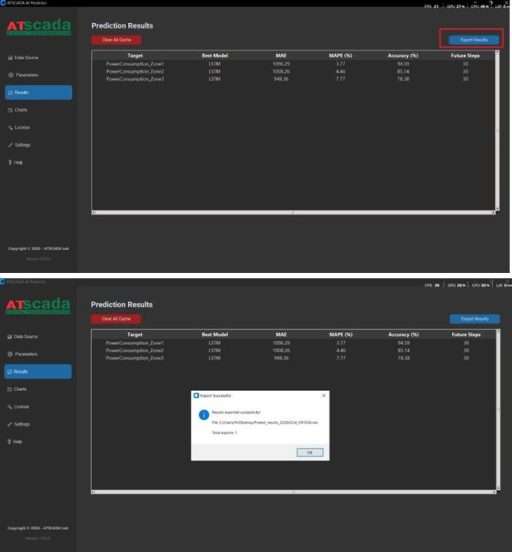
After the report is successfully generated, the system will automatically open the file and access it:
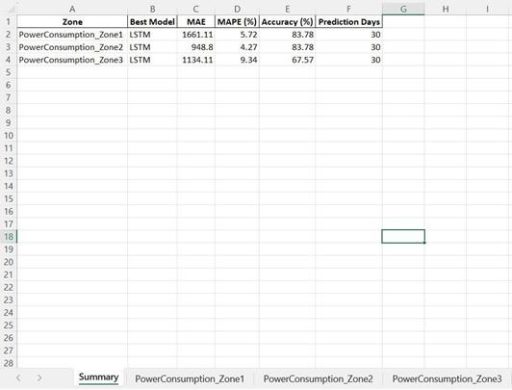
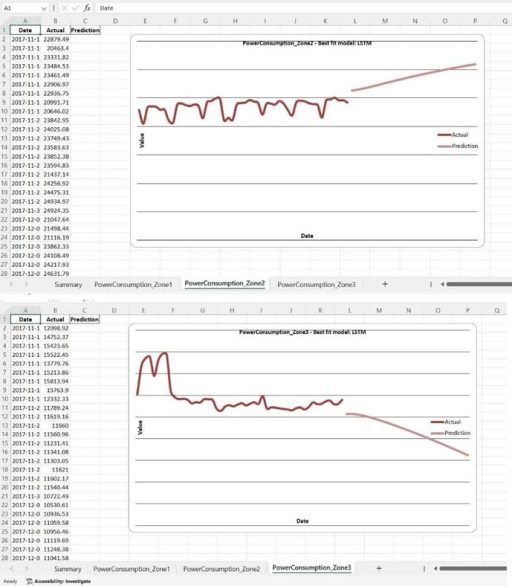
In the report export file, the data will be displayed in the Result tab. Additionally, there will be extra sheets depending on the column names in the data file selected in Step 1.

By selecting each sheet, you can view both the actual data and the predicted data from the system:
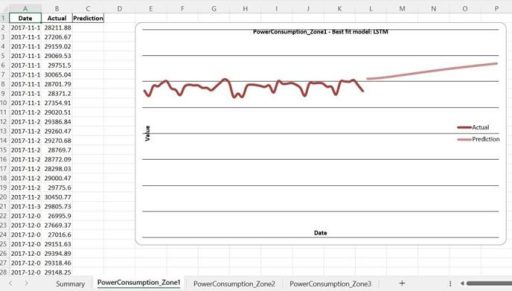
Step 4: View the results chart (Tab “Charts”)
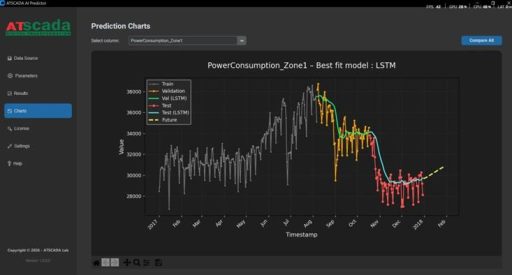
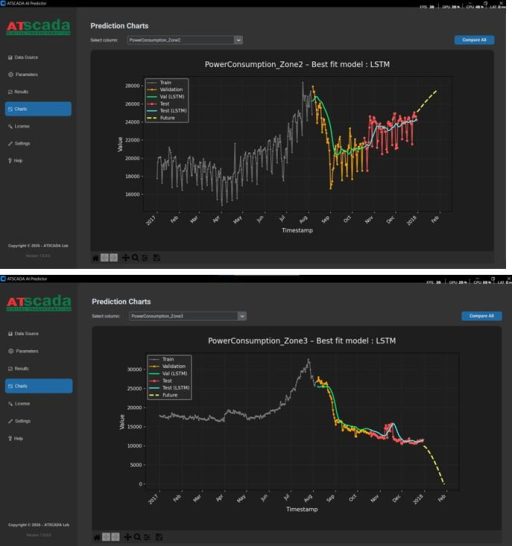
The Charts tab provides an interactive chart interface that helps users visually observe, compare, and analyze forecasting performance, with deployment options through ATSCADA Fastweb industrial web SCADA applications.. The chart is designed to highlight actual trends, historical forecasts (validation/test), and future forecasts.
| Component | Color | Description |
|---|---|---|
| Train | Light Gray | Actual data from the file selected in Step 1 |
| Validation | Orange Yellow | The time period used by the system to evaluate the model before future forecasting |
| Validation (Model Name) | Green | Model prediction results based on actual Validation data for performance scoring |
| Test | Red | The time period used by the system to recheck the model before future forecasting |
| Test (Model Name) | Blue | Model prediction results based on actual Test data for performance scoring |
| Future | Yellow | Values predicted by the AI model |
Interactive Features:
| Action | Effect |
|---|---|
| Left-click and drag | Move the chart |
| Zoom in/out | Zoom the time axis by selecting the desired area |
| Reset | Clear all actions and return the chart to the original position |

How to Read the Chart:
Ideal Situation:
• The Validation (Model Name) line closely follows the Validation (Actual) line during the Validation phase.
• The Test (Model Name) line closely follows the Test (Actual) line during the Test phase.
Warning:
• If these two lines are far from the Actual lines, it may result in high MAPE, meaning future forecasts may be unreliable.
View license key information (Tab “License”)
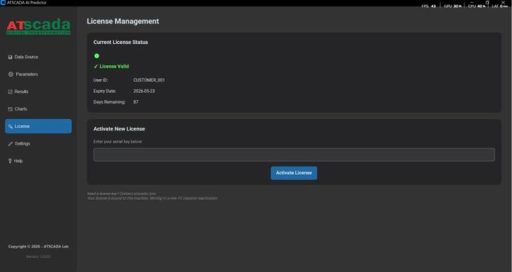
Users can view license key information provided by ATSCADA Lab:
• User ID: Name assigned to the license key by ATSCADA Lab
• Expiry Date: Expiration date of the license key
• Days Remaining: Remaining days of the license key
In addition, users can activate a new license key if provided by ATSCADA Lab.
Configure data when exporting Excel reports (Tab “Settings”)
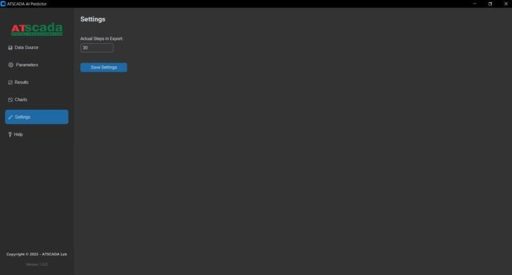
The “Actual Steps in Export” section configures the number of historical data points to export to the Excel file for easy comparison with future prediction data. (Default is 30 points).
👉 Learn More about ATSCADA Software

ATSCADA - Smart SCADA Software with AI Predictor & Blockchain. ATSCADA is an advanced SCADA software platform for real-time monitoring, intelligent control, and efficient data acquisition. It is ideal for Industrial IoT (IIoT), smart cities, integrated automation systems, and Agriculture 4.0. With a built-in AI Predictor, ATSCADA enables predictive analytics to detect issues early, optimize performance, and reduce downtime. The integration of Blockchain technology ensures secure, transparent, and tamper-proof data management. Highly scalable and easy to integrate, ATSCADA is trusted by businesses to enhance productivity, strengthen cybersecurity, and accelerate digital transformation.
Bài viết liên quan
ATSCADA Mobile Alarm Application for SCADA Alerts
The ATSCADA Mobile Alarm Application is a smart mobile solution developed by ATSCADA Lab, designed [...]
Apr
ATSCADA Fastweb -Industrial Web SCADA Applications
iWebService Tool The iWebService tool is a software component developed by ATSCADA Lab, operating in [...]
Apr
ATSCADA IExcelPouringTools – Smart Excel Pouring Data Management for Industrial Automation
ATSCADA IExcelPouringTools is a powerful toolkit designed to generate Excel reports from pre-built templates without [...]
Apr
ATSCADA IWebAPI Tools – Web API Integration Tools for Modern SCADA Systems
The ATSCADA IWebAPI toolset is designed to retrieve data from ATDriver Server and expose it [...]
Apr
ATSCADA IFTP – Advanced FTP File Transfer Tools for Industrial SCADA Systems
ATSCADA IFTP is a specialized FTP communication toolkit designed for industrial automation and environmental monitoring [...]
Apr
ATSCADA iEnergy– Smart Energy Monitoring and Management System
ATSCADA iEnergy Tools is an extension library (plugin) for the ATSCADA SCADA system, working alongside [...]
Apr