SCADA Software
ATSCADA Power Management System
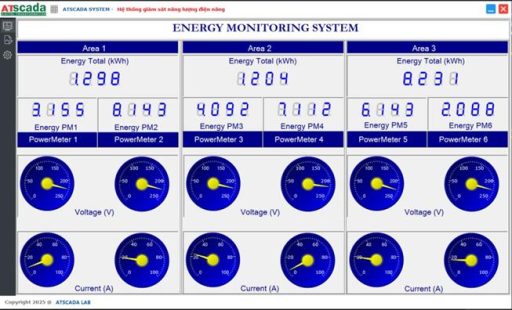
Requirements: There are 3 areas that require power management, including a factory, a residential zone, and households. Each area has 2 power meters. It is necessary to build a monitoring system that can view the parameters of all meters and display the electrical diagram of the 3 areas on the Web for easy monitoring and operation. The system must calculate electricity costs according to the 3 time-of-use tariff periods regulated by the government. ATSCADA Power Management System
Prepare the TagFile and plan the system structure
Step 1
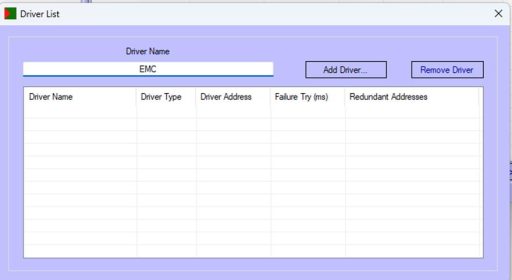
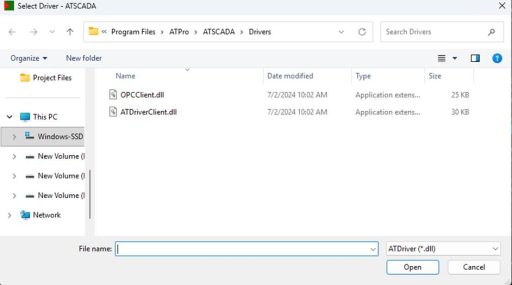
Create the ATDriverServer file:
• Enter the Channel name:
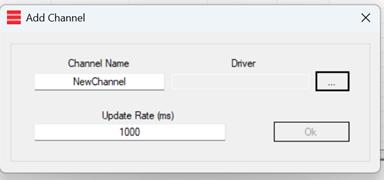
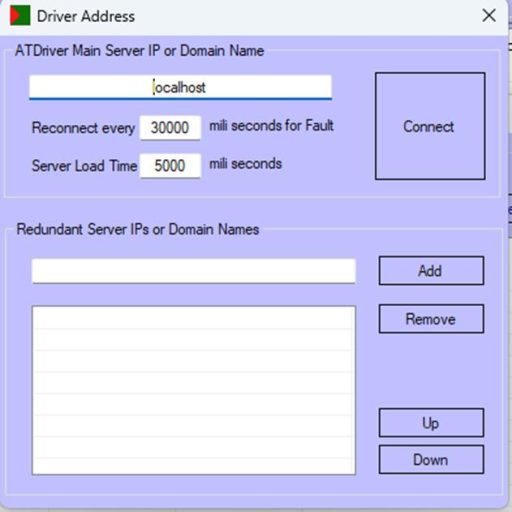
Select the driver, then enter the port and IP address of the server while following common troubleshooting guide steps if connection issues occur.
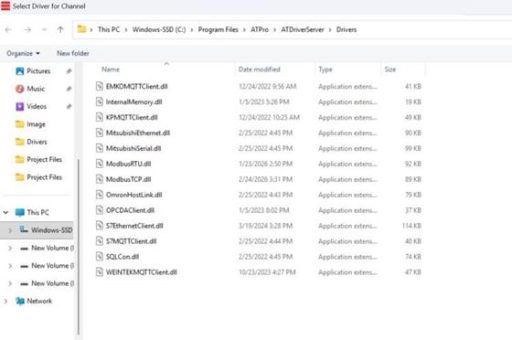
Here’s the demo where I chose InternalMemory. You can choose depending on your device’s communication settings.
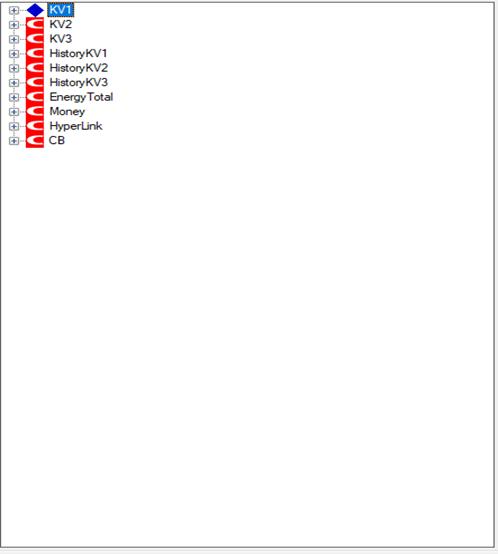
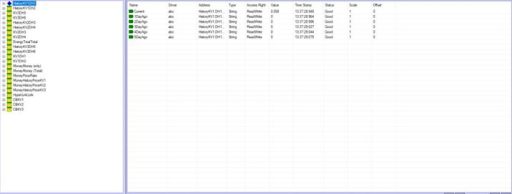
Create Tags:
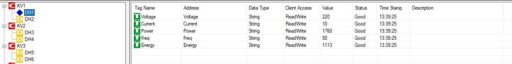
This demo is designed for the ATSCADA Power Management System with 3 areas and 6 power meters, where each area has 2 meters. For each meter, the values that need to be monitored include:
- Voltage value
- Current value
- Power value
- Frequency value
- Energy consumption value
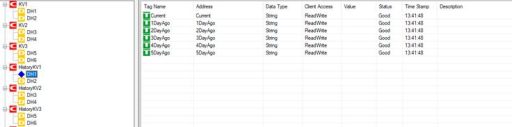
For each watch, we will create a tag to store its value history.
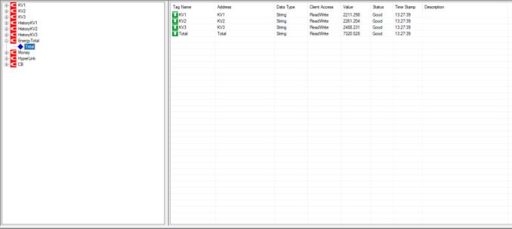
Create tags to record the total energy consumption in 3 areas and the overall consumption of all 3 areas.
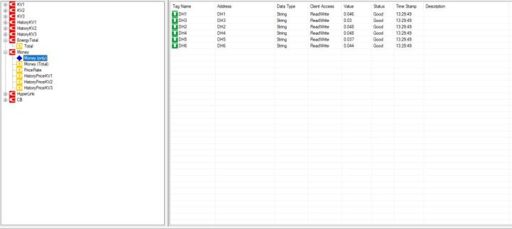
In the Money channel, create drivers to store the monthly electricity bill amounts for each household and each area.
The TagName Hyperlink stores the links of the pages, and Driver CB stores the status of each circuit breaker for every meter, supporting feature design for FastWeb in the ATSCADA Power Management System.
Step 2
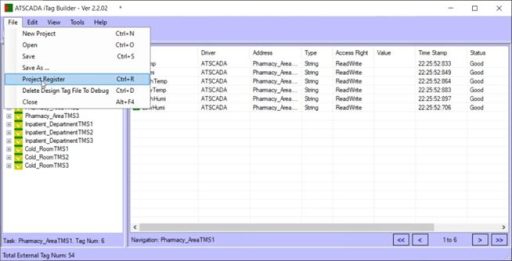
Register the TagFile with iTagBuilder, create the project, and add the Driver.
Select ATDriverClient
Use localhost if you’re using your computer’s IP address; otherwise, enter the address of the server running ATDriverServer.
After creating the project, we will add the tags created in ATDriverServer by:
Clicking on Tools->Import All-> selecting Server-> OK. After successful addition.
Finally, select File => Project Register to complete TagFile registration.
Create the Desktop Application with Visual Studio for the ATSCADA Power Management System
Step 1
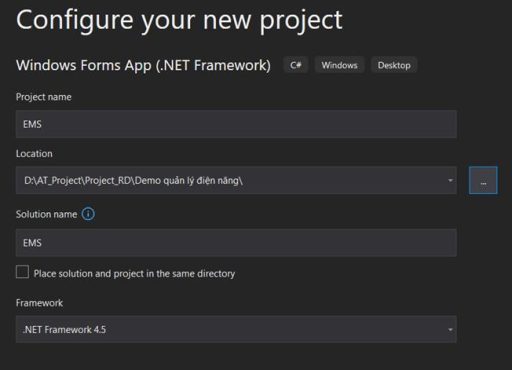
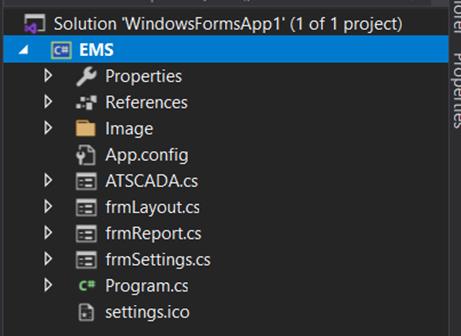
Create a new project in Visual Studio, name it EMS, and select .NET Framework 4.5.
Step 2
Proceed to create the Form Layouts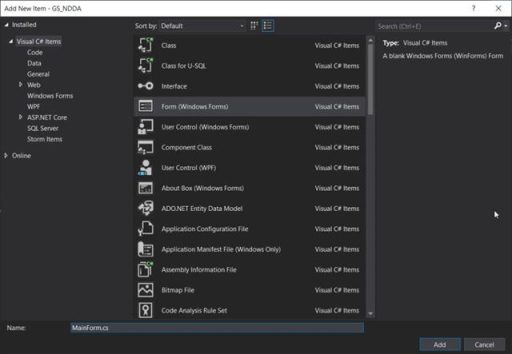
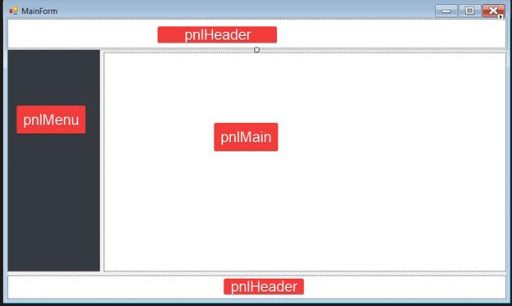
MainForm is the main outer layout, containing the header, footer, left menu, main layout, and other elements.
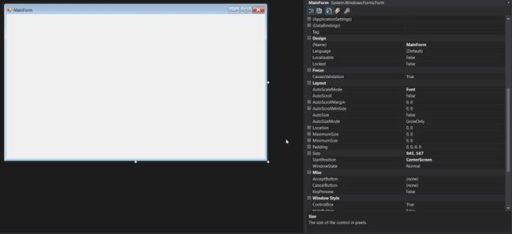
First, we need to drag the Panels (located in the Toolbox) to divide the layout for the MainForm.
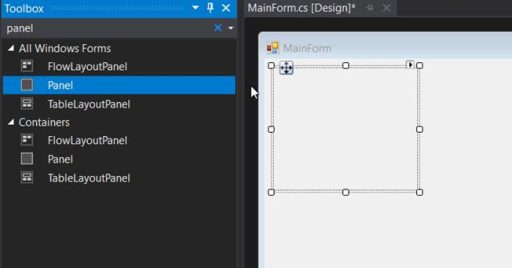
It consists of four main parts: Header, Menu, Main, and Footer.
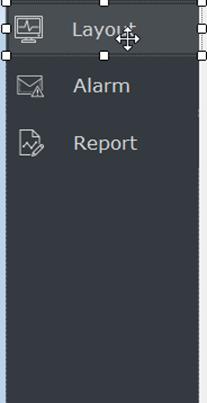
In the pnlMenu section, we add Toolbox Buttons to facilitate Form navigation in Winforms Applications.
Change the text and image of the Button to match the image shown.
In the pnlHeader section, we similarly add toolboxes such as Label, Button, and PictureBox to make the header more visually appealing. Change the properties of each toolbox to achieve the result shown in the image.
![]()
In the pnlFooter section, we also add labels to display information.
![]()
In summary, after adding the basic toolboxes, we get the following MainForm:
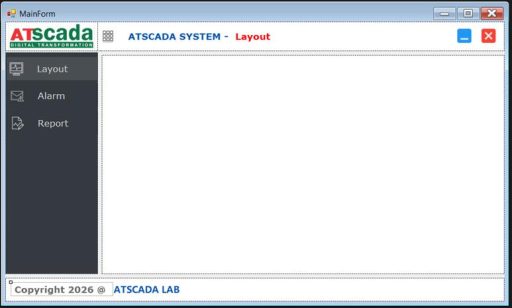
Create three additional forms: Layout, Alarm, and Report, to be displayed in pnlMain.
Step 3
Create Events in the WinForms Application for the ATSCADA Power Management System.
Switch to the Code Behind interface inside WinForms by right-clicking the form name and selecting View Code.
First, create Click Events assigned to the Buttons in the Header and Menu sections to navigate the main page content in the center area:
using System;
using System.Drawing;
using System.Windows.Forms;
namespace GS_NDDA
{
public partial class MainForm : Form
{
private Button activeButton;
private frmLayout frmLayout;
private frmReport frmReport;
private frmAlarm frmAlarm;
public MainForm()
{
InitializeComponent();
btnLayout.Click += btnDashboard_Click;
btnAlarm.Click += BtnAlarms_Click;
btnReport.Click += btnReport_Click;
btnMinimize.Click += btnMinimize_Click;
btnClose.Click += btnClose_Click;
Init();
}
private void Init()
{
activeButton = btnLayout;
btnMenu.Click += BtnMenu_Click;
this.pnlMain.Paint += PnlMain_Paint;
btnLayout.FlatAppearance.MouseOverBackColor = btnLayout.BackColor;
btnLayout.BackColorChanged += (s, e) =>
{
btnLayout.FlatAppearance.MouseOverBackColor = btnLayout.BackColor;
};
btnAlarm.FlatAppearance.MouseOverBackColor = btnAlarm.BackColor;
btnAlarm.BackColorChanged += (s, e) =>
{
btnAlarm.FlatAppearance.MouseOverBackColor = btnAlarm.BackColor;
};
btnReport.FlatAppearance.MouseOverBackColor = btnReport.BackColor;
btnReport.BackColorChanged += (s, e) =>
{
btnReport.FlatAppearance.MouseOverBackColor = btnReport.BackColor;
};
foreach (Control control in this.pnlMain.Controls)
control.Click += (sender, e) =>
{
if (this.InvokeRequired)
{
this.Invoke((Action)(() =>
{
this.pnlMenu.Width = 43;
this.isHide = true;
return;
}));
return;
}
this.pnlMenu.Width = 43;
this.isHide = true;
};
}
private void PnlMain_Paint(object sender, PaintEventArgs e)
{
NavigateToLayout();
}
private void BtnMenu_Click(object sender, EventArgs e)
{
if (isHide)
{
if (this.InvokeRequired)
{
this.Invoke((Action)(() =>
{
this.pnlMenu.Width = 129;
this.isHide = false;
return;
}));
return;
}
this.pnlMenu.Width = 129;
this.isHide = false;
}
else
{
if (this.InvokeRequired)
{
this.Invoke((Action)(() =>
{
this.pnlMenu.Width = 43;
this.isHide = true;
return;
}));
return;
}
this.pnlMenu.Width = 43;
this.isHide = true;
}
}
bool isHide = true;
private void btnDashboard_Click(object sender, EventArgs e)
{
if (this.activeButton == btnLayout) return;
if (this.InvokeRequired)
{
this.Invoke((Action)(() =>
{
NavigateToLayout();
return;
}));
return;
}
NavigateToLayout();
}
private void BtnAlarms_Click(object sender, EventArgs e)
{
if (this.activeButton == btnAlarm) return;
if (this.InvokeRequired)
{
this.Invoke((Action)(() =>
{
NavigateToAlarm();
return;
}));
return;
}
NavigateToAlarm();
}
private void btnReport_Click(object sender, EventArgs e)
{
if (this.activeButton == btnReport) return;
if (this.InvokeRequired)
{
this.Invoke((Action)(() =>
{
NavigateToReport();
return;
}));
return;
}
NavigateToReport();
}
private void NavigateToLayout()
{
this.activeButton = btnLayout;
this.lblNavigate.Text = "Layout";
btnLayout.BackColor = Color.FromArgb(73, 78, 83);
btnAlarm.BackColor = Color.Transparent;
btnReport.BackColor = Color.Transparent;
if (this.frmLayout is null)
{
this.frmLayout = new frmLayout() { Dock = DockStyle.Fill, TopLevel = false, TopMost = true };
this.frmLayout.Show();
this.pnlMain.Controls.Add(this.frmLayout);
}
this.frmLayout?.BringToFront();
this.frmReport?.SendToBack()
this.frmAlarm?.SendToBack();
}
private void NavigateToAlarm()
{
this.activeButton = btnAlarm;
this.lblNavigate.Text = "Alarm";
btnAlarm.BackColor = Color.FromArgb(73, 78, 83);
btnLayout.BackColor = Color.Transparent;
btnReport.BackColor = Color.Transparent;
if (this.frmAlarm is null)
{
this.frmAlarm = new frmAlarm() { Dock = DockStyle.Fill, TopLevel = false, TopMost = true };
this.frmAlarm.Show();
this.pnlMain.Controls.Add(this.frmAlarm);
}
this.frmAlarm?.BringToFront();
this.frmLayout?.SendToBack();
this.frmReport?.SendToBack();
}
private void NavigateToReport()
{
this.activeButton = btnReport;
this.lblNavigate.Text = "Report";
btnReport.BackColor = Color.FromArgb(73, 78, 83);
btnLayout.BackColor = Color.Transparent
btnAlarm.BackColor = Color.Transparent;
if (this.frmReport is null)
{
this.frmReport = new frmReport() { Dock = DockStyle.Fill, TopLevel = false, TopMost = true };
this.frmReport.Show();
this.pnlMain.Controls.Add(this.frmReport);
}
this.frmReport?.BringToFront();
this.frmLayout?.SendToBack();
this.frmAlarm?.SendToBack();
}
private void btnMinimize_Click(object sender, EventArgs e)
{
this.WindowState = FormWindowState.Minimized;
}
private void btnClose_Click(object sender, EventArgs e)
{
DialogResult result = MessageBox.Show("Are you sure you want to exit?",
"Exit?",
MessageBoxButtons.YesNo,
MessageBoxIcon.Question);
if (result == DialogResult.Yes) this.Close();
}
private void lblATSCADA_Click(object sender, EventArgs e)
{
System.Diagnostics.Process.Start("https://atscada.com/");
}
}
}
With the Event_Click functions such as btnReport_Click, BtnAlarms_Click, and btnDashboard_Click, users can switch the Main section to display the content of forms such as frmAlarms and frmReports that were created earlier in the ATSCADA Power Management System.
Step 4
Create content for the frmLayout file.
This is the main form where values read from the meters will be displayed, such as temperature, humidity, or real-time charts, etc.
Drag a Toolbox TabControl into frmLayout and name the two tabs Home and Settings as shown in the image.
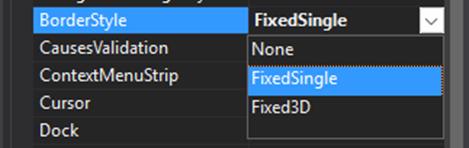
• Use the Panel tool to divide the layout sections as shown. In Properties, you can customize panel attributes such as 3D style or colors for the ATSCADA Power Management System.

• Use the Label tool to write the text.
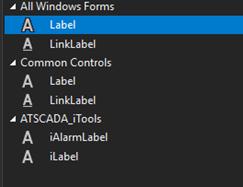
Enter text in the text box to change the font.
![]()
Change font size and font type.
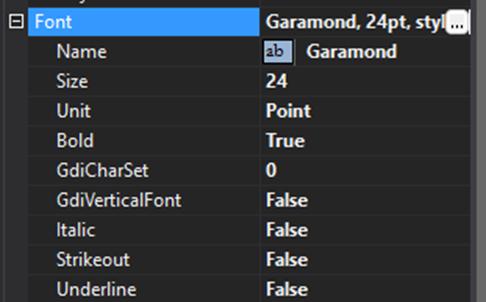
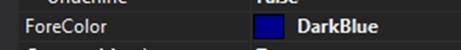
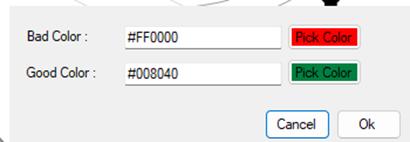
Change the color of the text.
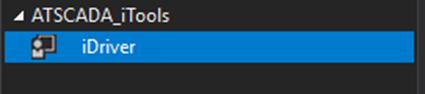
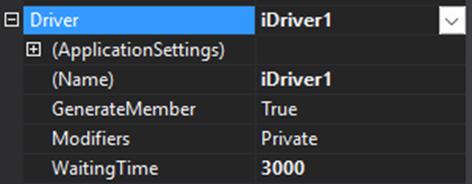
• Use the iDriver tool to link the tags registered on iTagBuilder with WinForm.
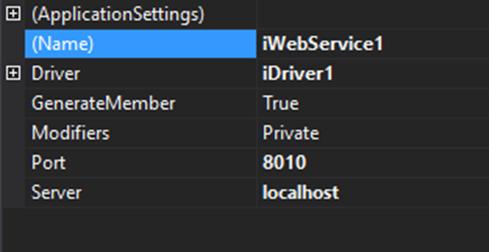
• Use the iWebServer tool to link the tags to the website.
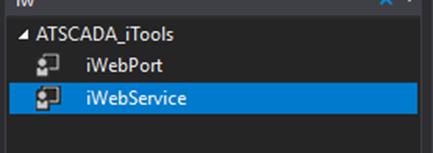
Select the driver, then enter the port and IP address of the server.
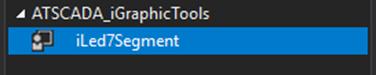
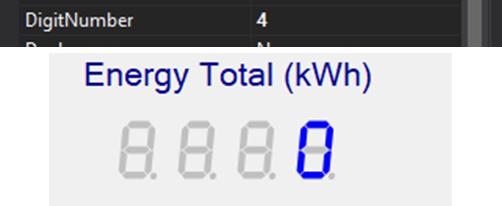
• Use the iLedSegment tool in iGraphicTools to create meters that display energy consumption.
To display it, you need to set some parameters as follows:
Select the driver for the tool.
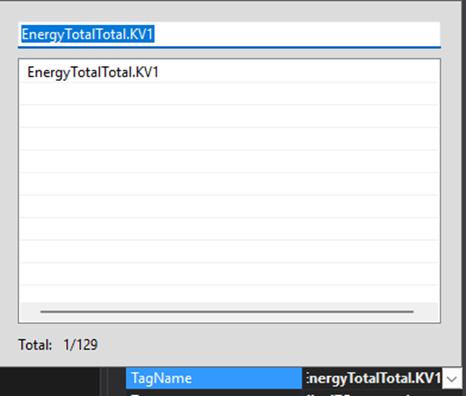
Select the tag you want to display.
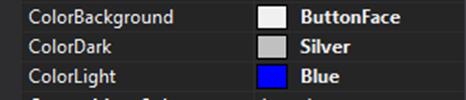
Adjust the colors of the LED display.
Enter the number of LEDs on the LED display; if you enter 4, it will display 4 digits.
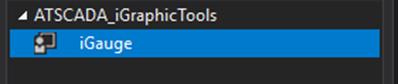
• Use the iGauge tool to create analog meters that display Voltage and Current.
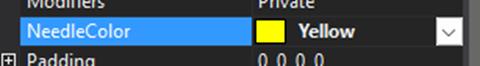
Steps to set parameters:
Adjust the clock color
![]()
The color of the needle.
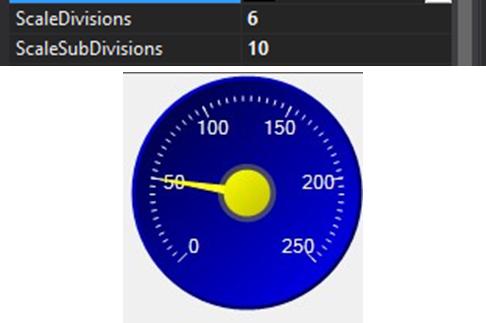
Adjust the color of the numbers on the clock.
![]()
Adjust the markings, and the meter will display 6 main values with 10 smaller markings between them.
Several tools are used to calculate electricity consumption and log it to a database.
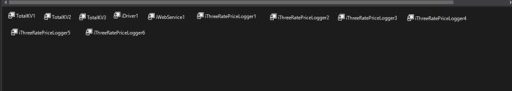
The TotalKVx tools are used to sum the energy values of the meters within the same area in the ATSCADA Power Management System, with the following configuration steps:
o First, select the same Driver as the two tools above.
o Next, click Collection and choose the values that need to be added together.
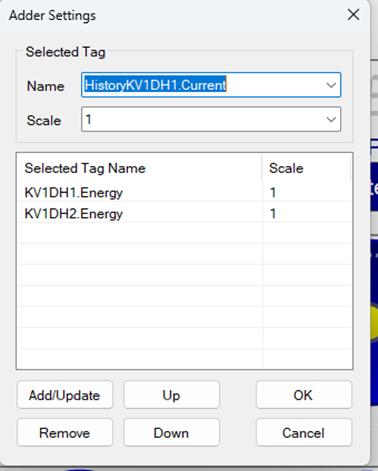
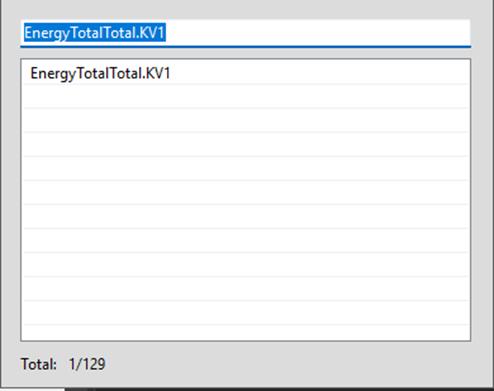
Finally, select Tag to save the values after addition.
The iThreeRatePriceLogger tools support electricity cost calculation based on power consumption with 3 pricing levels according to government regulations and log data into the database for the ATSCADA Power Management System.
Configuration steps:
o First, select the Driver.
o Next, configure the Datalog settings.
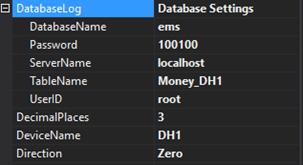
Enter the three price values for the time slots; these can be entered directly or via an intermediate tag declared in ATDriverServer.
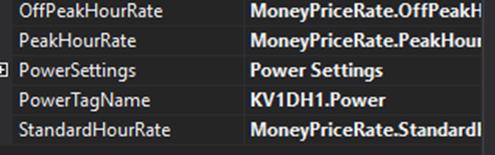
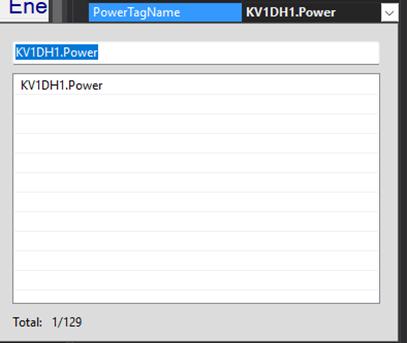
Select the input power for the calculation.
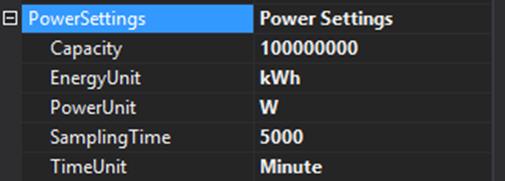
Configure PowerSetting. Capacity is the sampling threshold value of Power; if the value is higher, it will not be collected.
Select the measurement units the same as the values read from the meter. TimeUnit is the calculation interval. For example, if set to Minute, the accumulated power will be calculated after 1 minute in the ATSCADA Power Management System.
Create the Web Application with FastWeb Designer of the ATSCADA Power Management System
Use Inkscape software to create a homepage interface image for your website as an SVG file.
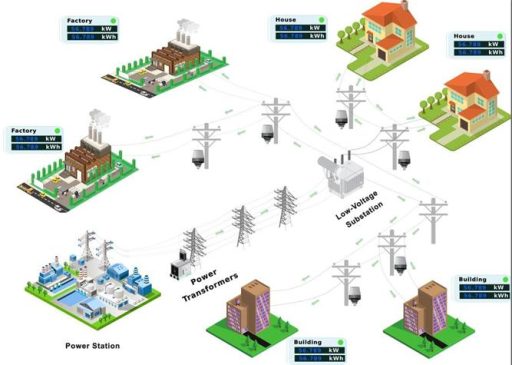
Model of the power grid diagram from the power plant to 3 areas: Industrial park – High-rise building – Residential area
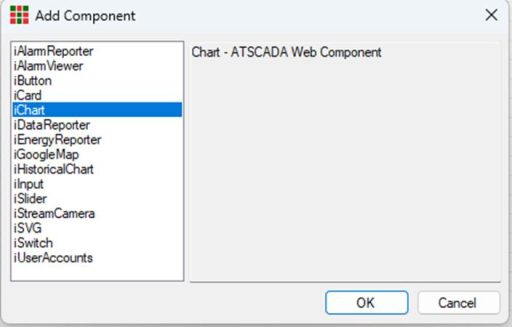
Use FastWebDesigner software to create web components.
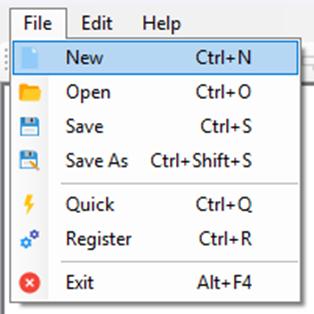
To create a project, click File -> New.
Enter the project name and other information.
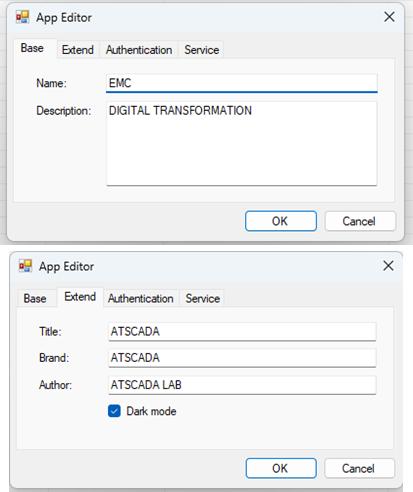
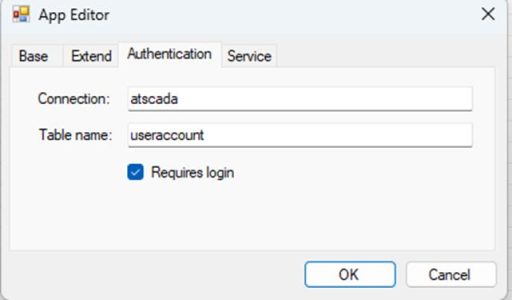
Connect to the database storing web account and password information.
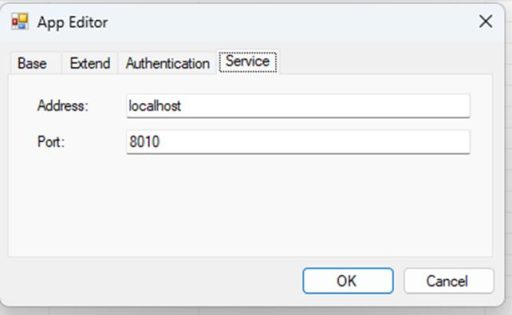
Set the IP address and port the same as in the iWebServer tool to link with the tags in Winform.
After creating the project, we begin designing by adding each view (each view is a page with a different URL).
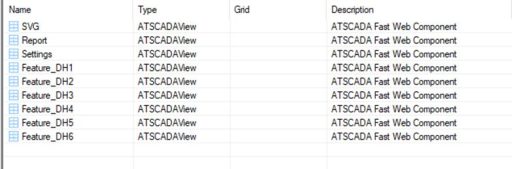
Each page is laid out in rows and columns.
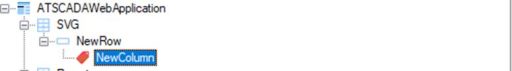
On the SVG page, we add the iSVG component, which supports linking with the iSVG editor software to associate tags with SVG images.
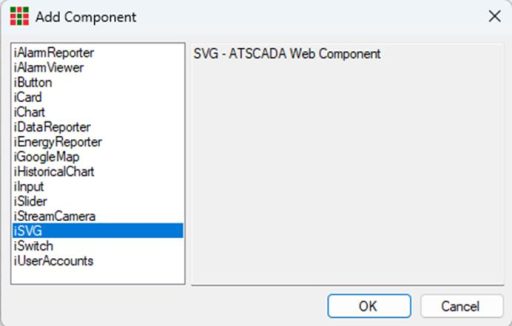
Enter the page name
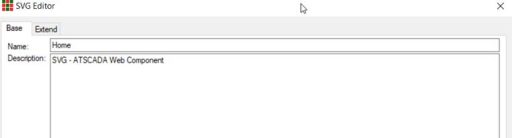
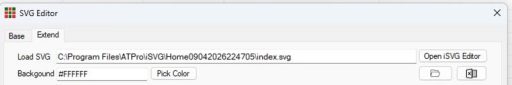
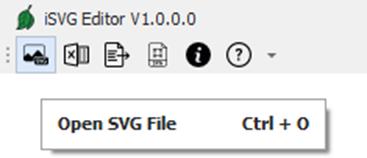
Click on “Open iSVG Editor” to open the software.
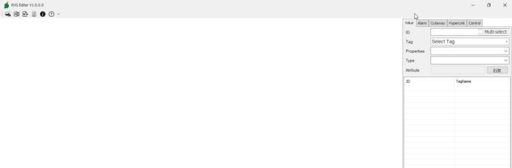
Add the SVG file to the software.
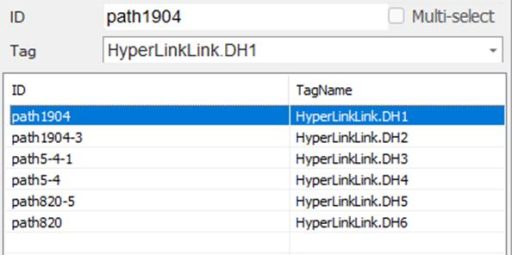
Now, we will link the tags that need to be displayed to the SVG images.
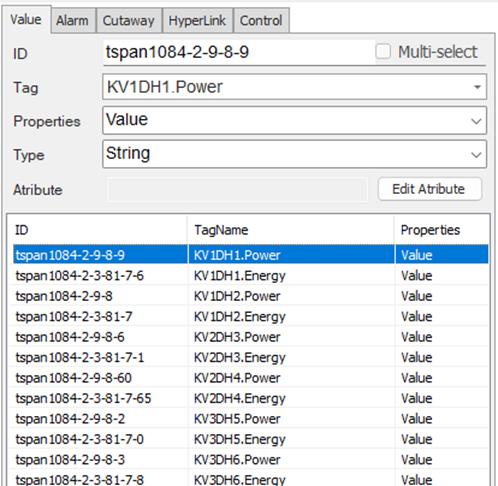
Step 1
Click on the component you want to link.
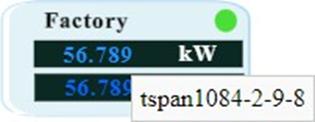
Step 2
Set the parameters
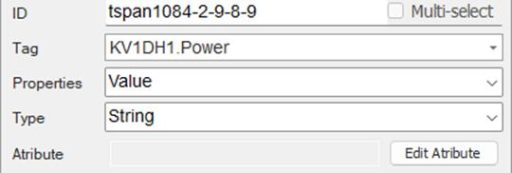
Select the Tag you want to link to the Component
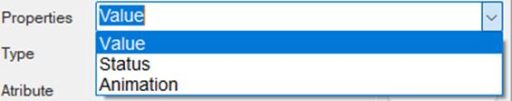
In the Properties section, select Value to display the Tag value on the Web for the selected component in the ATSCADA Power Management System.
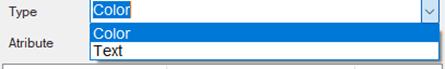
Select Status to display the connection status of the Tag. In Type, there are 2 options: choose Color to display colors, or Text to display custom text as configured.
>Step 1: Create the views as shown above.
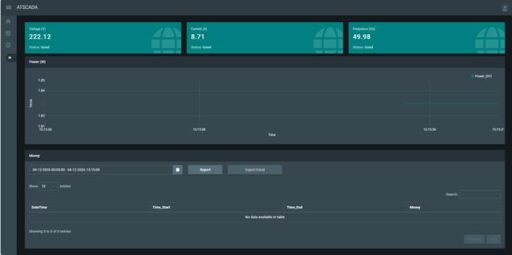
As shown in the interface above, the ATSCADA Power Management System includes meter parameters such as U, I, and Frequency, a chart displaying Power values, and a Report showing electricity costs calculated based on power consumption, with options for secure industrial data management.
The following are the steps to create the web page above:
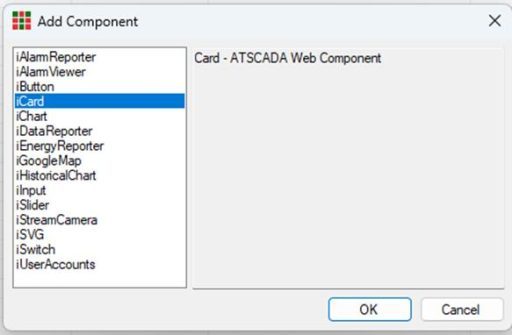
Create the iCard Component.
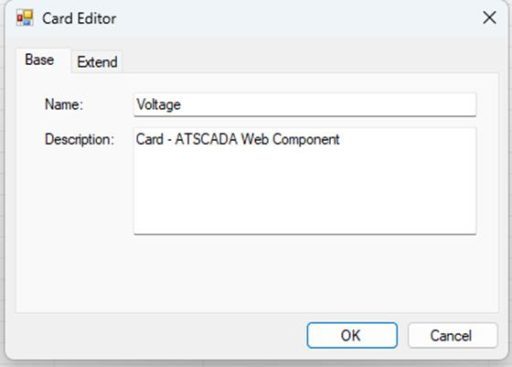
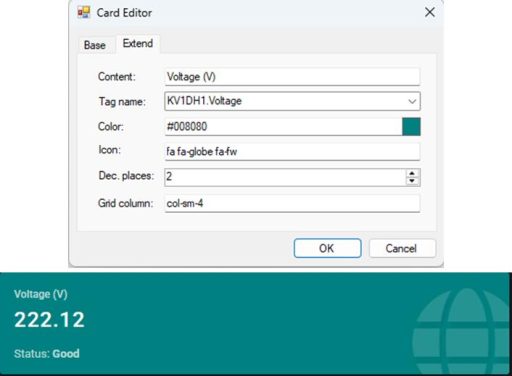
Content: Display name shown on the Web in the ATSCADA Power Management System.
Tag Name: The Tag value that needs to be displayed. Color is used to select the Card color.
Icon: Enter the selected Icon code (codes can be taken from websites).
GridColumn: The number represents the width of the Card (the full page has 12 columns). As shown below, the Card is occupying 4 columns.
Create the chart.
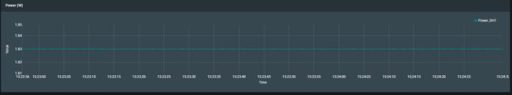
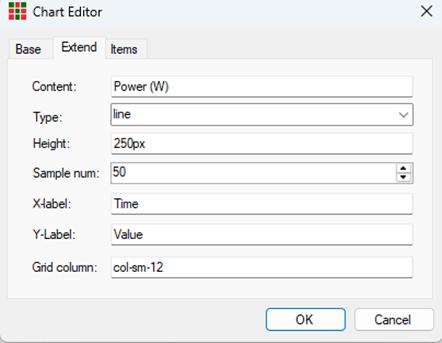
Create the iChart selection component.
Next, enter the name and description similar to iCard in the ATSCADA Power Management System. The parameters include:
Content: The Chart name displayed on the Web.
Type: Select the chart type. In this example, a line chart is used, so choose Line.
Sample Num: Number of samples.
X Label, Y Label: Names of the X and Y axes in the chart.
Grid column: Chart width measured in cells
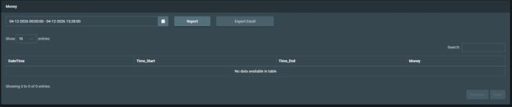
Create the component, then select iDataReporter.
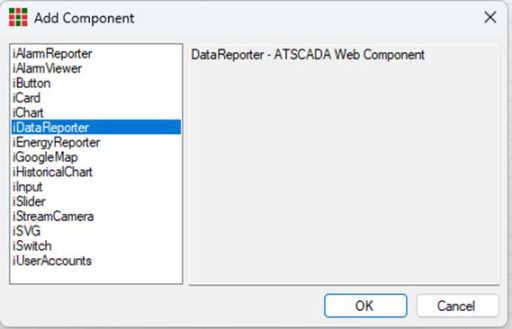
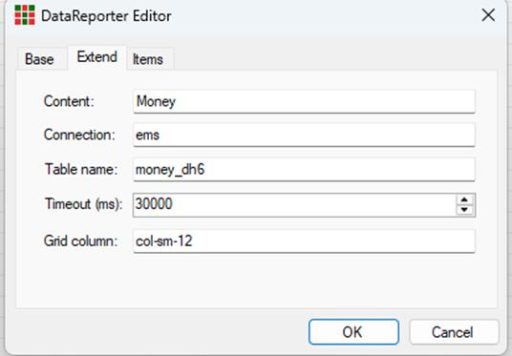
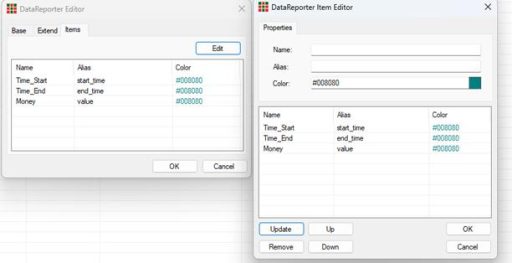
Next, enter the name and description similar to iCard in the ATSCADA Power Management System. Configuration parameters include:
Content: Name of the report table.
Connection: Enter the Database name to be connected for reporting.
Table Name: Name of the table to be reported in the database.
Timeout (ms): Report refresh time for each cycle.
Grid Column: Width of the table based on grid columns.


ATSCADA - Smart SCADA Software with AI Predictor & Blockchain. ATSCADA is an advanced SCADA software platform for real-time monitoring, intelligent control, and efficient data acquisition. It is ideal for Industrial IoT (IIoT), smart cities, integrated automation systems, and Agriculture 4.0. With a built-in AI Predictor, ATSCADA enables predictive analytics to detect issues early, optimize performance, and reduce downtime. The integration of Blockchain technology ensures secure, transparent, and tamper-proof data management. Highly scalable and easy to integrate, ATSCADA is trusted by businesses to enhance productivity, strengthen cybersecurity, and accelerate digital transformation.
Related articles
Common ATSCADA Errors and How to Fix Them – FAQ for ATSCADA Tools and Systems
Issues Related to ATDriverServer & iTagBuilder Software Why Does ATDriverServer Not Open? There are two [...]
May
ATSCADA Hospital Temperature and Humidity Monitoring Alarm System Project
Requirements: The system includes three monitoring areas: the pharmacy, inpatient warehouse, and cold storage, following [...]
May
ATSCADA CookBook: Complete Guide to System Architecture, Tools, Installation & Troubleshooting
The ATSCADA Training book is an essential navigation structure that helps users access all major [...]
Apr
ATSCADA Project Deployment Guide: Create and Run Projects on Another Computer
ATSCADA Project Deployment is an essential process for transferring a completed SCADA project from the [...]
Apr
How to Create a New Custom Component for Windows Forms Applications
Purpose of the Component This ATSCADA Custom Component is designed to automatically accumulate values from [...]
Apr
ATSCADA Blockchain Toolkit – Secure Industrial Data Management with Smart Technology
Introduction Real-world issues in industrial SCADA systems SCADA data is the lifeblood of smart factories, [...]
Apr