SCADA Software
ATSCADA Hospital Temperature and Humidity Monitoring Alarm System Project
Requirements: The system includes three monitoring areas: the pharmacy, inpatient warehouse, and cold storage, following a structured project deployment guide for multi-zone monitoring systems.. Each area is equipped with three temperature and humidity meters, totaling nine devices. An ATSCADA hospital monitoring solution is required to collect data from all nine meters into a centralized desktop application. The system should feature real-time trend charts, high/low data logging, alarm notifications when thresholds are exceeded, and comprehensive environmental monitoring for all storage areas.
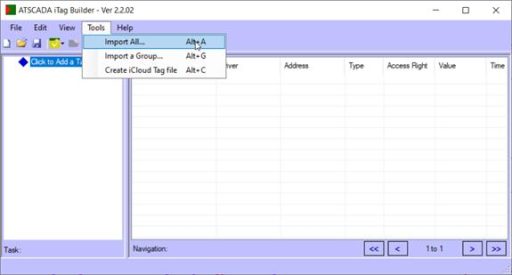
Prepare the TagFile and Plan the System
Step 1
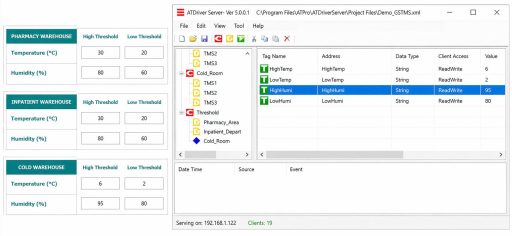
Open ATDriverServer and create Channels named after the three monitoring areas. For demonstration purposes, the selected driver is InternalMemory.dll to store simulated values for the ATSCADA hospital monitoring system.
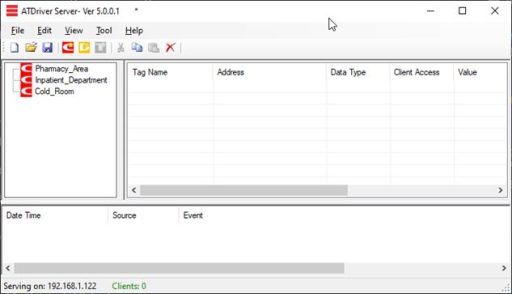
Pharmacy_Area: Pharmacy monitoring area
Inpatient_Department: Inpatient storage area
Cold_Room: Cold storage area
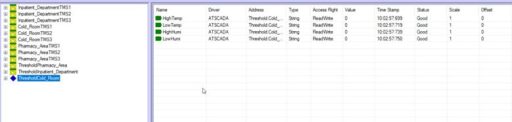
Threshold: Channel used to store High and Low values for each area in the ATSCADA hospital monitoring system.
Step 2
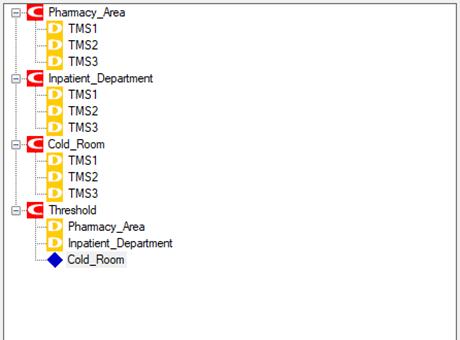
Create Devices. Since each area has three temperature and humidity meters, create three Devices corresponding to each Channel (*TMS is the meter name).
Step 3
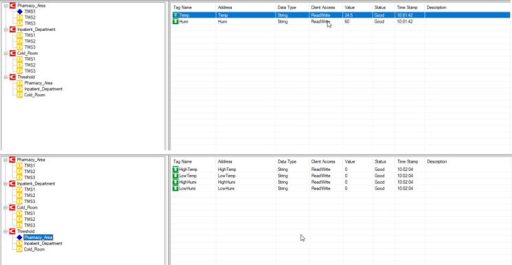
Create TagNames representing the register addresses of the clock. Specifically, in this demo, each device will have two tags: Temp (temperature) and Humi (humidity).
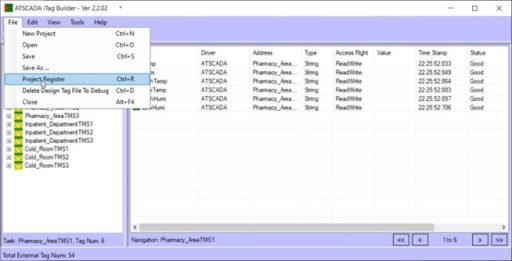
Step 4
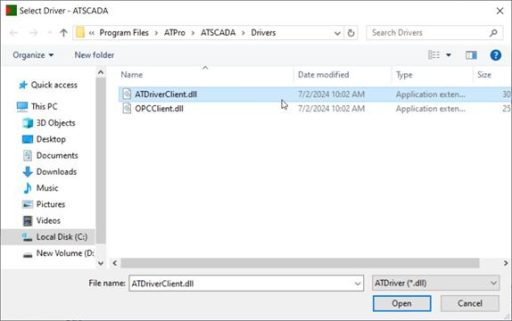
TagFile
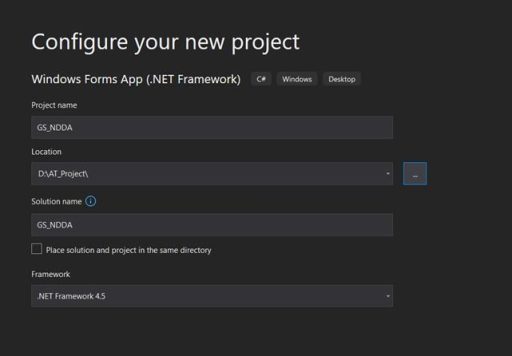
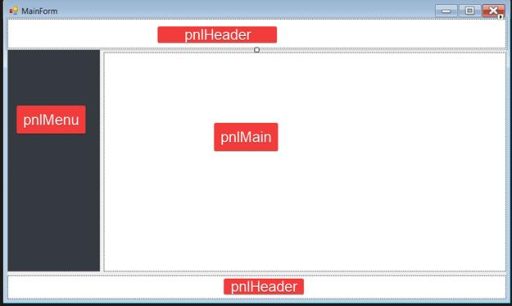
Create a Desktop App with Visual Studio
Step 1
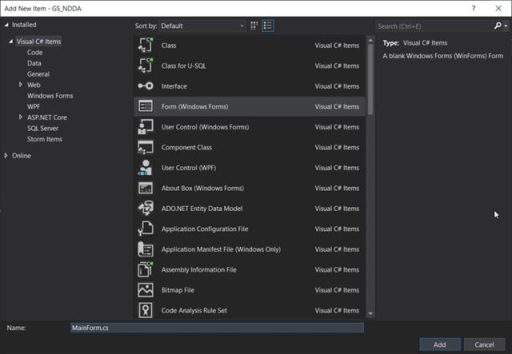
Step 2
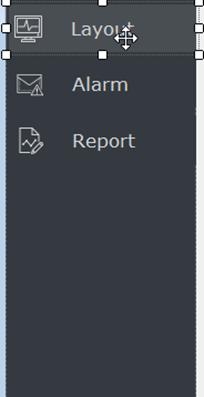
Change the text and image of the Button to match the image shown.
Step 3
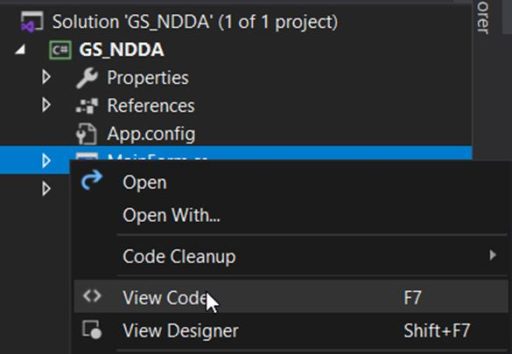
We switch to the Code Behind interface within Winforms by right-clicking on the form name and selecting View Code
First, we create Click Events assigned to the Buttons in the Header and Menu sections to redirect the main page to the center:
using System;
using System.Drawing;
using System.Windows.Forms;
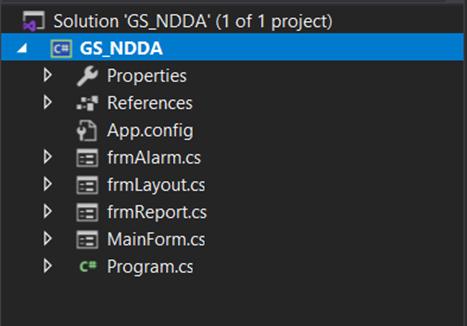
namespace GS_NDDA
{
public partial class MainForm : Form
{
private Button activeButton;
private frmLayout frmLayout;
private frmReport frmReport;
private frmAlarm frmAlarm;
public MainForm()
{
InitializeComponent();
btnLayout.Click += btnDashboard_Click;
btnAlarm.Click += BtnAlarms_Click;
btnReport.Click += btnReport_Click;
btnMinimize.Click += btnMinimize_Click;
btnClose.Click += btnClose_Click;
Init();
}
private void Init()
{
activeButton = btnLayout;
btnMenu.Click += BtnMenu_Click;
this.pnlMain.Paint += PnlMain_Paint;
btnLayout.FlatAppearance.MouseOverBackColor = btnLayout.BackColor;
btnLayout.BackColorChanged += (s, e) =>
{
btnLayout.FlatAppearance.MouseOverBackColor = btnLayout.BackColor;
};
btnAlarm.FlatAppearance.MouseOverBackColor = btnAlarm.BackColor;
btnAlarm.BackColorChanged += (s, e) =>
{
btnAlarm.FlatAppearance.MouseOverBackColor = btnAlarm.BackColor;
};
btnReport.FlatAppearance.MouseOverBackColor = btnReport.BackColor;
btnReport.BackColorChanged += (s, e) =>
{
btnReport.FlatAppearance.MouseOverBackColor = btnReport.BackColor;
};
foreach (Control control in this.pnlMain.Controls)
control.Click += (sender, e) =>
{
if (this.InvokeRequired)
{
this.Invoke((Action)(() =>
{
this.pnlMenu.Width = 43;
this.isHide = true;
return;
}));
return;
}
this.pnlMenu.Width = 43;
this.isHide = true;
};
}
private void PnlMain_Paint(object sender, PaintEventArgs e)
{
NavigateToLayout();
}
private void BtnMenu_Click(object sender, EventArgs e)
{
if (isHide)
{
if (this.InvokeRequired)
{
this.Invoke((Action)(() =>
{
this.pnlMenu.Width = 129;
this.isHide = false;
return;
}));
return;
}
this.pnlMenu.Width = 129;
this.isHide = false;
return;
}));
return;
}
this.pnlMenu.Width = 43;
this.isHide = true;
}
}
bool isHide = true;
private void btnDashboard_Click(object sender, EventArgs e)
{
if (this.activeButton == btnLayout) return;
if (this.InvokeRequired)
{
this.Invoke((Action)(() =>
{
NavigateToLayout();
return;
}));
return;
}
NavigateToLayout();
}
private void BtnAlarms_Click(object sender, EventArgs e)
{
if (this.activeButton == btnAlarm) return;
if (this.InvokeRequired)
{
this.Invoke((Action)(() =>
{
NavigateToAlarm();
return;
}));
return;
}
NavigateToAlarm();
}
private void btnReport_Click(object sender, EventArgs e)
{
if (this.activeButton == btnReport) return;
if (this.InvokeRequired)
{
this.Invoke((Action)(() =>
{
NavigateToReport();
return;
}));
return;
}
NavigateToReport();
}
private void NavigateToLayout()
{
this.activeButton = btnLayout;
this.lblNavigate.Text = "Layout";
btnLayout.BackColor = Color.FromArgb(73, 78, 83);
btnAlarm.BackColor = Color.Transparent;
btnReport.BackColor = Color.Transparent;
if (this.frmLayout is null)
{
this.frmLayout = new frmLayout() { Dock = DockStyle.Fill, TopLevel = false, TopMost = true };
this.frmLayout.Show();
this.pnlMain.Controls.Add(this.frmLayout);
}
this.frmLayout?.BringToFront();
this.frmReport?.SendToBack();
this.frmAlarm?.SendToBack();
}
private void NavigateToAlarm()
{
this.activeButton = btnAlarm;
this.lblNavigate.Text = "Alarm";
btnAlarm.BackColor = Color.FromArgb(73, 78, 83);
btnLayout.BackColor = Color.Transparent;
btnReport.BackColor = Color.Transparent;
if (this.frmAlarm is null)
{
this.frmAlarm = new frmAlarm() { Dock = DockStyle.Fill, TopLevel = false, TopMost = true };
this.frmAlarm.Show();
this.pnlMain.Controls.Add(this.frmAlarm);
}
this.frmAlarm?.BringToFront();
this.frmLayout?.SendToBack();
this.frmReport?.SendToBack();
}
private void NavigateToReport()
{
this.activeButton = btnReport;
this.lblNavigate.Text = "Report";
btnReport.BackColor = Color.FromArgb(73, 78, 83);
btnLayout.BackColor = Color.Transparent;
btnAlarm.BackColor = Color.Transparent;
if (this.frmReport is null)
{
this.frmReport = new frmReport() { Dock = DockStyle.Fill, TopLevel = false, TopMost = true };
this.frmReport.Show();
this.pnlMain.Controls.Add(this.frmReport);
}
this.frmReport?.BringToFront();
this.frmLayout?.SendToBack();
this.frmAlarm?.SendToBack();
}
private void btnMinimize_Click(object sender, EventArgs e)
{
this.WindowState = FormWindowState.Minimized;
}
private void btnClose_Click(object sender, EventArgs e)
{
DialogResult result = MessageBox.Show("Are you sure you want to exit?",
"Exit?",
MessageBoxButtons.YesNo,
MessageBoxIcon.Question);
if (result == DialogResult.Yes) this.Close();
}
private void lblATSCADA_Click(object sender, EventArgs e)
{
System.Diagnostics.Process.Start("https://atscada.com/");
}
}
}
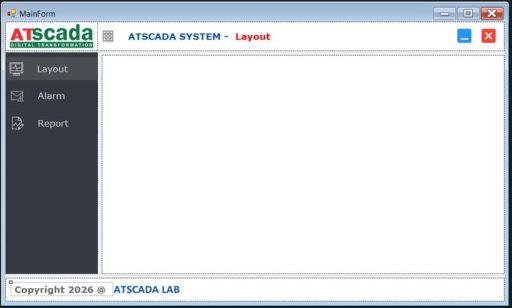
With Event_Click functions such as btnReport_Click, BtnAlarms_Click, and btnDashboard_Click, users can switch the main content area between forms such as frmAlarms and frmReports, which were created earlier for the ATSCADA hospital monitoring system.
Step 4
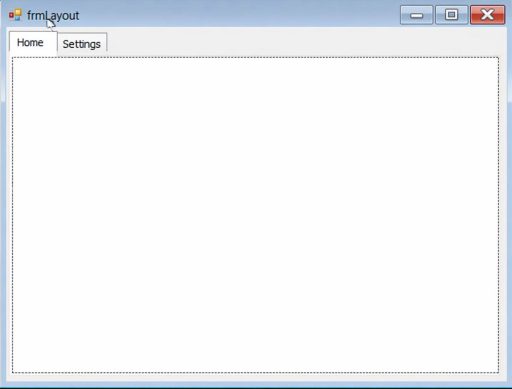
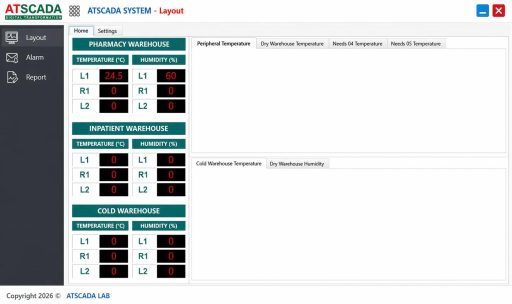
Create the Layout for frmLayout
This is the main form where all meter readings such as temperature, humidity, and real-time charts will be displayed.
Drag a Toolbox TabControl into frmLayout and rename the two tabs as Home and Settings as shown in the design layout.
On the Home tab, we divide the layout into two parts: one side is used to directly display the values read from the ATDriverServer tagname, and the other side is for iRealTimeTrend charts to visualize the data using graphs.
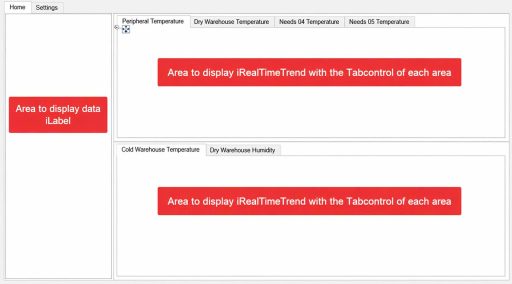
In the iLabel data display area, drag the iLabel Toolboxes from the ATSCADA iTools suite that we added earlier.
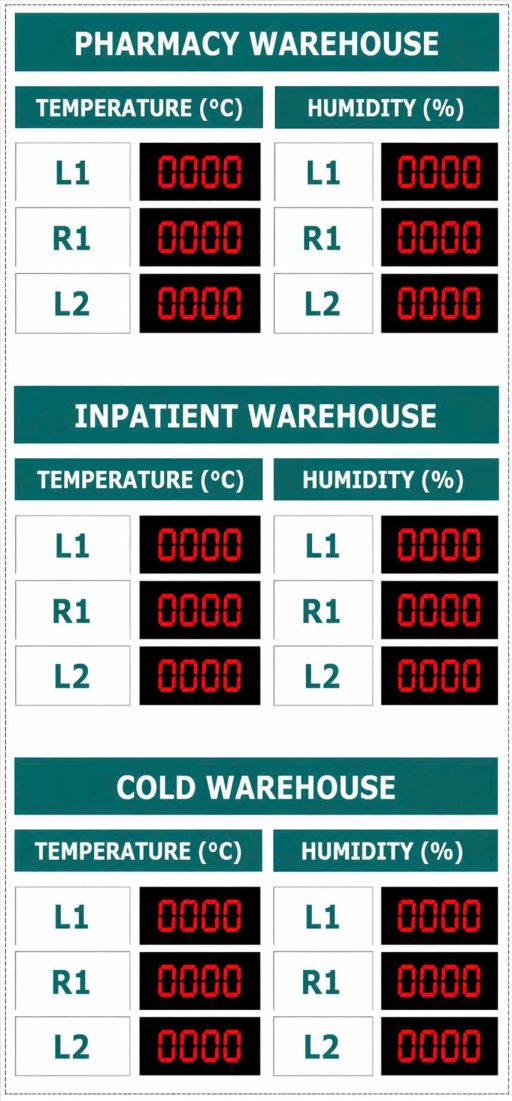
The iLabel component is used to simulate an LED display panel in the ATSCADA hospital monitoring system. Configure the Properties as follows:
- BackColor: Black
- ForeColor: Red
- Font Size: 12pt
- TextAlign: Middle Center
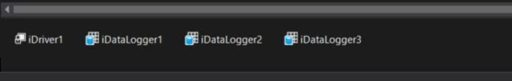
After completing the interface setup, assign the correct TagName values to each corresponding monitoring area. Before assigning TagNames, it is required to drag the iDriver component into the form so the predefined TagNames from ATDriverServer can be used.
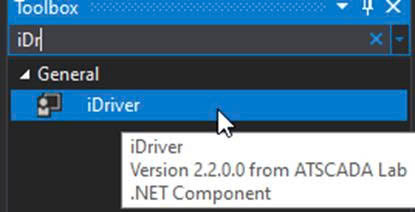
Proceed to set up the Properties for iLabel as follows: Driver: Select iDriver1
TagName: Assign the correct TagName as declared in ATDriverServer
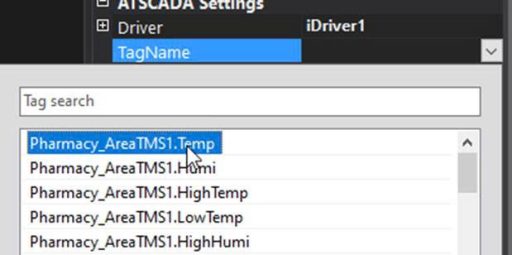
Example: In the pharmacy warehouse, position L1 corresponds to Device TMS1 and TagName
Temp name
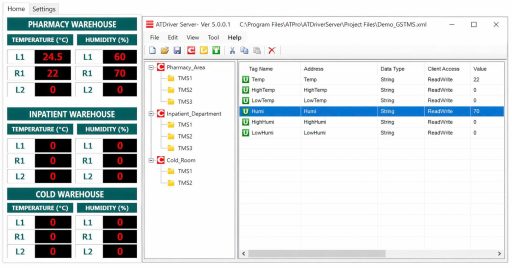
After successful declaration, proceed with testing.
Try changing the values of some TagNames in the ATDriverServer software to check if the TagNames are assigned correctly.
Next, we will set up the real-time charts using the iRealTimeTrend component included in the iTools installation package of ATSCADA.
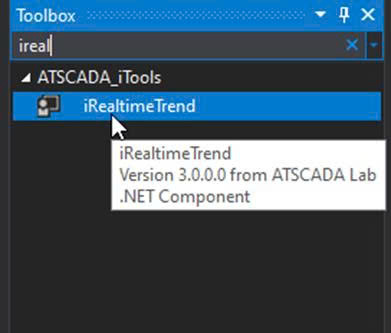
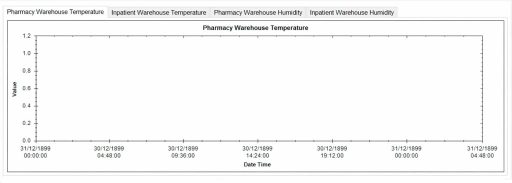
We will drag them into the Tabcontrol on the right-hand layout as we set up earlier. For each tab in the Tabcontrol, we will drag an iRealtimeTrend representing that area.
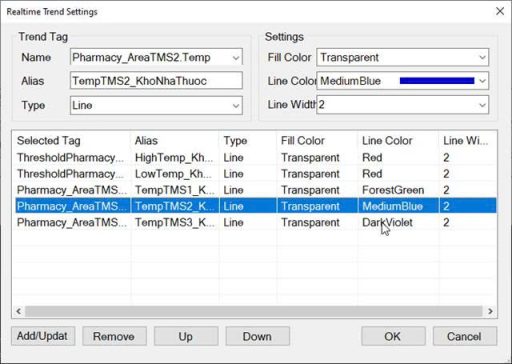
Configure iRealtimeTrend Properties for the ATSCADA hospital monitoring system:
- Driver: Select iDriver1
- Title: Rename according to each monitoring area
- Collection: Select the Device values of that specific area from ATDriverServer
Tips for Professional SCADA Real-Time Charts:
- High and Low threshold values should use red lines with a thicker Line Width for clear alarm visibility.
- Temperature and Humidity values should use cool contrasting colors to stand out against the red High/Low alarm lines, making the chart easier to monitor.
Set up similarly for the remaining areas. Proceed with testing.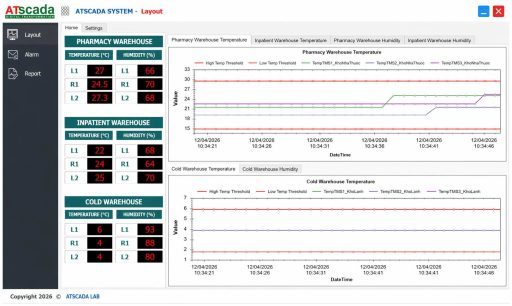
The layout setup is now complete for displaying sensor readings such as temperature and humidity, along with real-time data visualization using iRealtimeTrend in the ATSCADA hospital monitoring system.
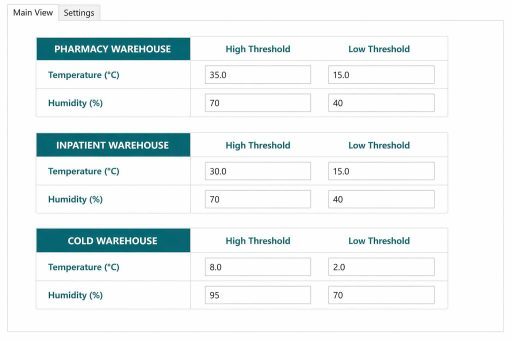
Move to the Settings tab on the TabControl
T create a layout that allows users to write High and Low threshold values to ATDriverServer.
To perform this function, use the iButton component from the ATSCADA iTools toolkit.
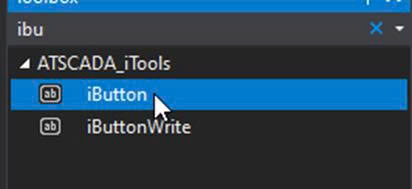
Set the iButton Properties as follows
Driver: select iDriver1
TagName: assign the correct TagName you want to write the value to in ATDriverServer
Proceed with testing
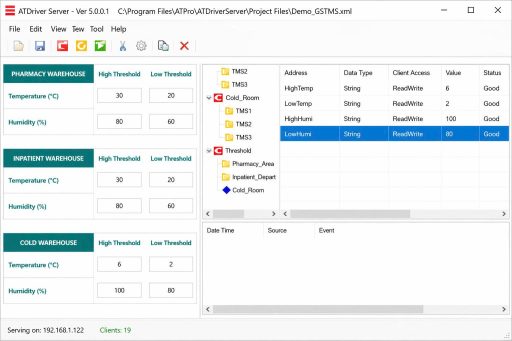
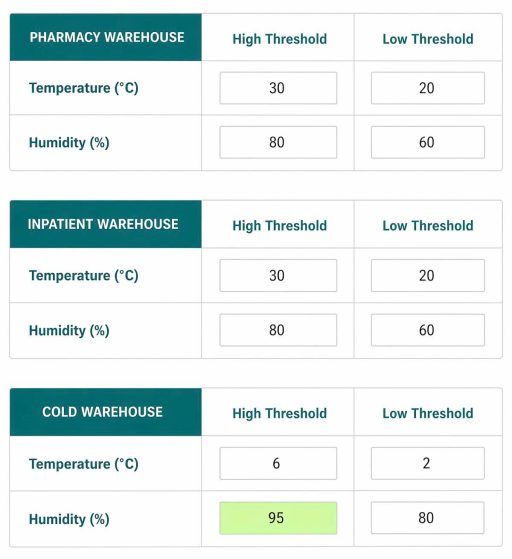
The Buttons have now been successfully configured, allowing users to quickly and conveniently write High and Low values to ATDriverServer within the ATSCADA hospital monitoring system.
Move to the Alarm tab to configure all settings related
To alarm notifications when faults occur or when monitored values exceed the defined High/Low thresholds.
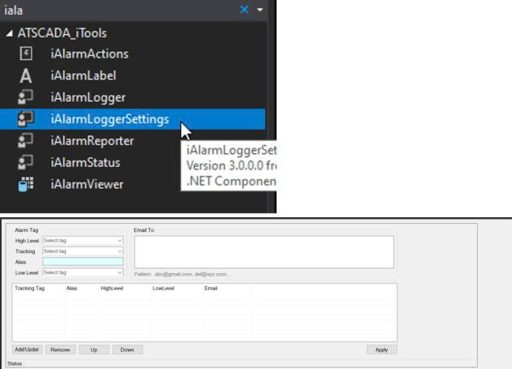
To set up Email alarm notifications for over-limit events, use the iAlarmLoggerSettings component included in the ATSCADA iTools toolkit.
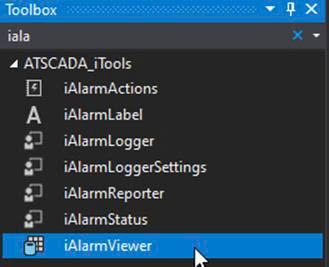
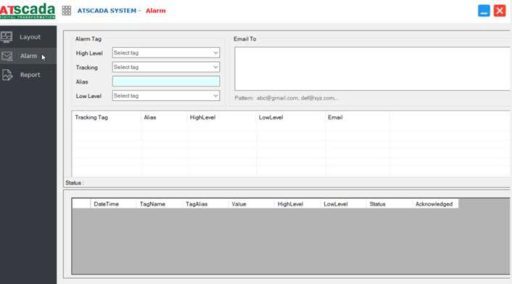
And another component, iAlarmViewer, is added to view the alarms that have occurred and are saved to the database.
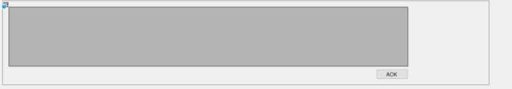
The overall interface of the Alarm form is as follows:
![]()
Configure the Properties for iAlarmLoggerSettings
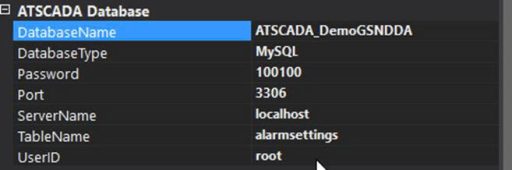
This configuration will automatically create a database with the corresponding name in DatabaseName, using the MySQL UserID and Password you have set up.
After successful setup, proceed to test.
Switch to the Alarm tab to view the frmAlarms interface you just set up.
Go into MySQL and log in
With the username root and password 100100, the same as in the setup step.
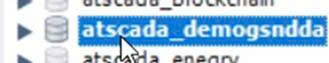
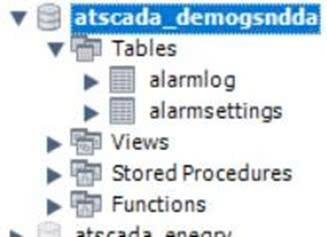
Check if the ATSCADA_DemoGSNDDA database has been created.
Clicking to view will reveal two tables: AlarmLog and AlarmSettings.
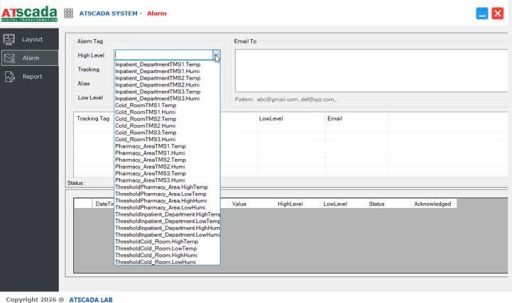
HighLevel: Corresponds to the HighTemp TagName of each monitoring area in the ATSCADA hospital monitoring system.
Tracking: Corresponds to the TagName of the actual value used for comparison.
Alias: Corresponds to the column name to be stored in the database.
LowLevel: Corresponds to the LowTemp TagName of each monitoring area.
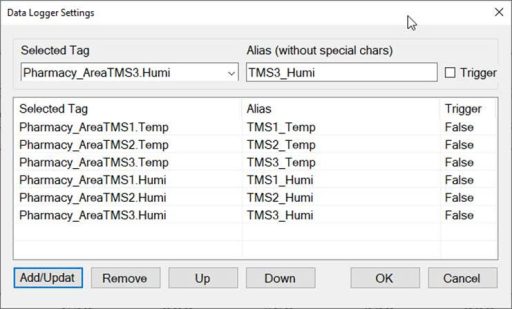
Example: Configuration for the Pharmacy Storage Area.
![]()
After adding the tag, click OK to save the TagName to the database.
Check the AlarmSettings table in the database to see the tag you just assigned.
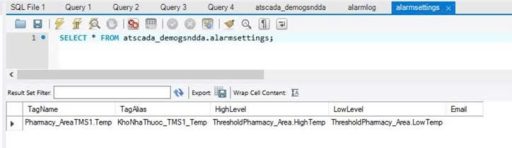
If you see this, then you have successfully set up AlarmSettings. Now, try changing the TMS1.Temp value beyond the threshold to see if it logs to the database.
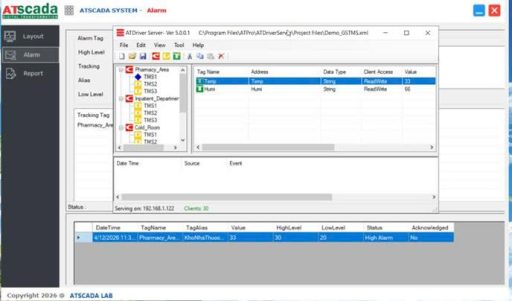
As shown, when values exceed the defined thresholds, the data is automatically stored in the database and instantly displayed on the previously configured iAlarmViewer in the ATSCADA hospital monitoring system.
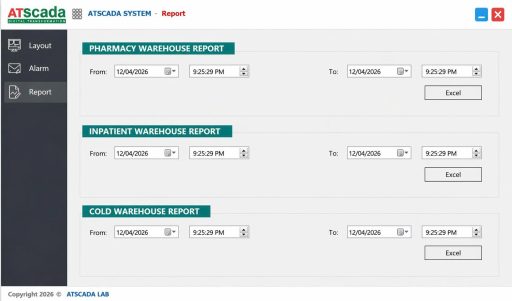
Move to the final tab, Report
To help users export reports and review all operational data during system runtime.
In the Report tab, use the iDataReporter component to support report generation and data export.
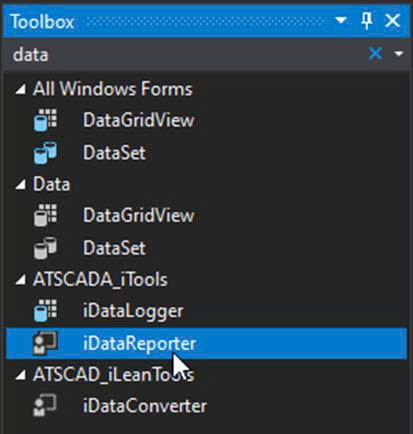
Set up properties for each iDataLogger Driver: Select iDriver1
LoggingTimerRate: To continuously store real-time data every 1 minute, enter the value 60000. This value is in milliseconds (60000 ms = 60 seconds = 1 minute) for the ATSCADA hospital monitoring system.
UpdateType: Timer
Collection: Select the required TagName values such as Temp and Humi for each monitoring area.
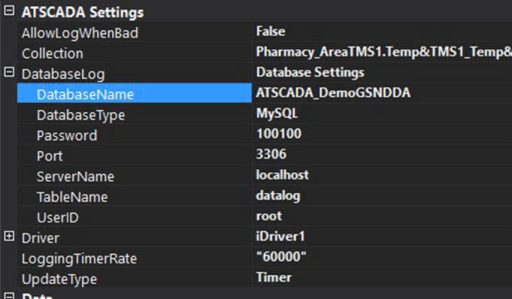
Then click OK to save the settings.
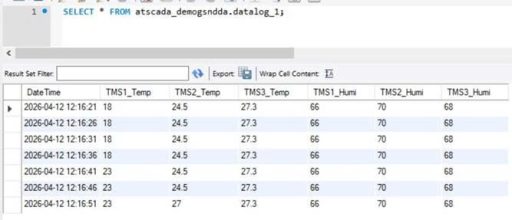
Run a test and check the database.
After the data has been logged to the database, we proceed to set up the properties of iDataReporter to export it to Excel.
👉 Learn More about ATSCADA Software


ATSCADA - Smart SCADA Software with AI Predictor & Blockchain. ATSCADA is an advanced SCADA software platform for real-time monitoring, intelligent control, and efficient data acquisition. It is ideal for Industrial IoT (IIoT), smart cities, integrated automation systems, and Agriculture 4.0. With a built-in AI Predictor, ATSCADA enables predictive analytics to detect issues early, optimize performance, and reduce downtime. The integration of Blockchain technology ensures secure, transparent, and tamper-proof data management. Highly scalable and easy to integrate, ATSCADA is trusted by businesses to enhance productivity, strengthen cybersecurity, and accelerate digital transformation.
Related articles
ATSCADA iStreamCameraTools – Industrial IP Camera Integration and Real-Time Video Monitoring
The iStreamCameraTools toolkit enables the connection of ONVIF-compatible cameras to receive camera streams and display [...]
Jun
OPC Server Connection Guide
Overview The ATSCADA ecosystem provides exceptional flexibility for integrating data from third-party OPC Servers (such [...]
Jun
Common ATSCADA Errors and How to Fix Them – FAQ for ATSCADA Tools and Systems
Issues Related to ATDriverServer & iTagBuilder Software Why Does ATDriverServer Not Open? There are two [...]
May
ATSCADA CookBook: Complete Guide to System Architecture, Tools, Installation & Troubleshooting
The ATSCADA Training book is an essential navigation structure that helps users access all major [...]
Apr
ATSCADA Power Management System
Requirements: There are 3 areas that require power management, including a factory, a residential zone, [...]
Apr
ATSCADA Project Deployment Guide: Create and Run Projects on Another Computer
ATSCADA Project Deployment is an essential process for transferring a completed SCADA project from the [...]
Apr