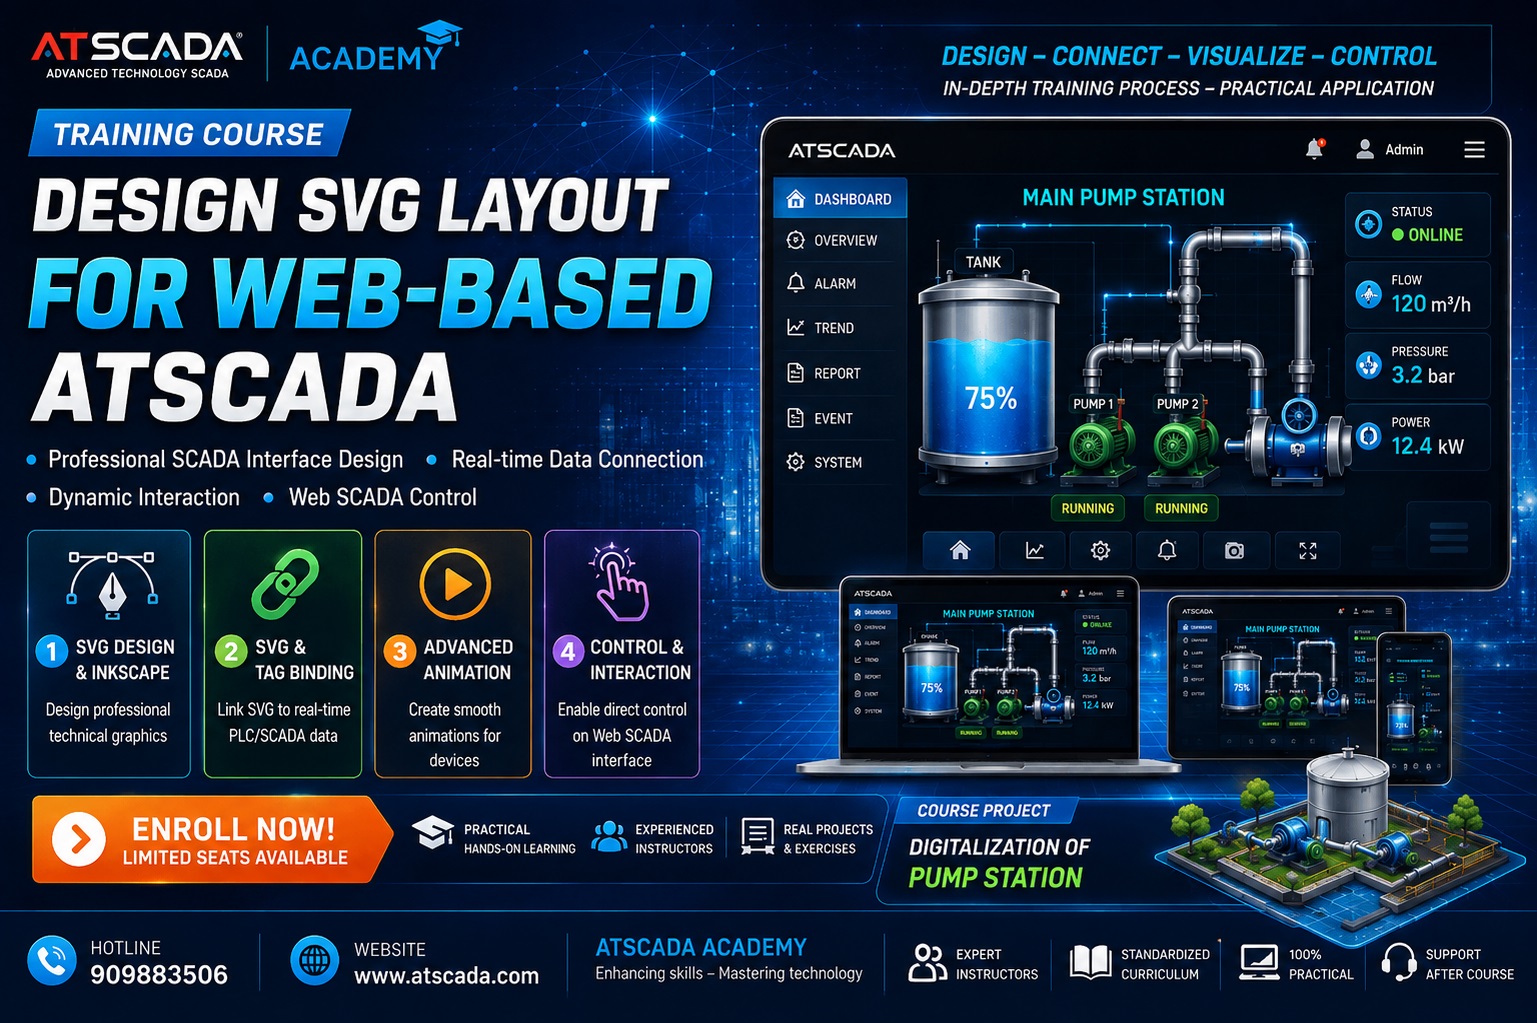
ATSCADA Web-Based Graphic Layout Training Course

This training course helps students, technicians, and engineers in the field of electrical engineering and automation to enhance their knowledge and gain experience.

Course Duration:  4 Sessions – Learning Format: Online via Google Meet

We are giving away high-quality and multi-disciplinary ATSCADA training materials to our students.

sign up now


Why should you take the SCADA course at ATSCADA?

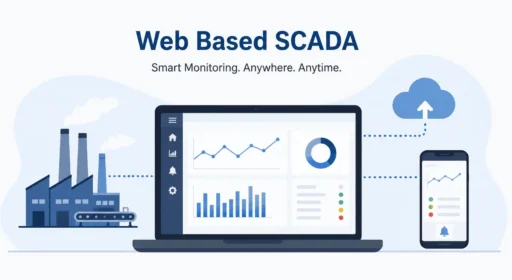
Web Based SCADA Systems for modern industrial monitoring with cloud connectivity and realtime remote monitoring dashboard

ABOUT US

ATSCADA helps businesses grow further through comprehensive automation solutions.

ATSCADA Lab, a subsidiary of ATPro Corp, was formed and developed from the ATSCADA platform established in 2009, marking the beginning of our journey to build “Made in Vietnam” SCADA solutions. With a shared aspiration and long-term vision, we continuously research, develop, and refine core technology platforms, aiming to build a SCADA  software “empire”  with a distinct Vietnamese identity, capable of competing in regional and international markets.

Who should participate in the ATSCADA training course?

Many engineers struggle with SCADA systems because they rely solely on: Online tutorials that don’t require actual equipment –  ​​Disjointed documentation –  Outdated training methods

What was the result?  Slow progress, poor practical skills, and limited career advancement opportunities. ATSCADA has completely changed this.

Online Training Course Content: Web-Based ATSCADA Graphics Layout

Phase 1: SVG (Drawing & Tools) Design Tools and Thinking

Trainees need to master how to create the “heart” of the interface before integrating it into the SCADA system.

  • Introduction to SVG graphics:  Advantages of vector images in SCADA (no pixelation when enlarged, small file size, ability to manipulate individual objects via ID).
  • Introducing the SVG Library, a collection  of over 2900 SVG images covering various fields: Energy, Water Treatment, Manufacturing, Smart Buildings, and more.
  • Mastering Inkscape software:
    • Instructions for drawing process flow diagrams.
    • This technique uses Layers to manage components such as pipes, tanks, and pumps.
  • Object ID assignment technique:  This is the most important step. Students must know how to assign ID names (e.g., Pump_01, Tank_Level) to the parts they need to interact with so that the iSVG tool can identify and extract them later.

Phase 2: Data Integration and Mapping Process (iSVG Workflow)

This phase focuses on connecting still images with real-time data from iDriver.

  • Use the iSVG Editor tool:
    • How to embed an  iSVG component  into the Fastweb Designer interface.
    • The process involves loading the SVG files drawn from Inkscape into  the iSVG Editor  and the backup folder for future use.
  • Tag Binding Technique:  Instructions on how to click on an object in an SVG image so the tool automatically retrieves the ID, then select the corresponding Tag from  the ATDriver Server  to link it.
  • Status verification:  Set the display color based on the connection status (green for Good, red for Bad/Disconnected).

Phase 3: Advanced Attributes and Animation Effects

It helps the interface come alive like a real factory.

  • Color Animation:  Configure objects to blink or change color based on threshold values ​​(e.g., a tank blinks red when the pressure is too high, connection statuses blink to warn the user when an error occurs, etc.)
  • Liquid level simulation (Cut-Away):
    • Instructions for combining two objects (Tank casing and Level indicator).
    • Set the Min/Max values ​​so that the “water level” in the image automatically rises/falls according to the Tag value.
  • Hyperlinks:  Attach links to SVG objects to open relevant report pages or technical documents when the user clicks on them.

Phase 4: Direct Control and Interaction

Transform your monitoring interface into a true control panel via the Web.

  • Switch-style control:  Turn pump icons into On/Off buttons to control the device directly from your browser.
  • Analog control:  This technique involves clicking on an object to display a pop-up input dialog box, allowing the user to enter numerical values ​​into the device.
ATSCADA Web-Based Graphic Layout Training Course

Final year practical project: “Digitizing smart pumping stations”

Students must complete a comprehensive assignment including: