SCADA Software
ATSCADA iTools : Essential Tools for Desktop SCADA Applications
The ATSCADA iTools system is a collection of software components developed by ATSCADA Lab. These tools operate within the application layer (ATSCADA Applications) and interact directly with iDriver to process and manage data efficiently.
Step 1.Add the ATSCADA iTools Library to the Toolbox
Before starting, follow the ATSCADA installation guide to ensure all required files, runtime modules, and dependencies are installed correctly.
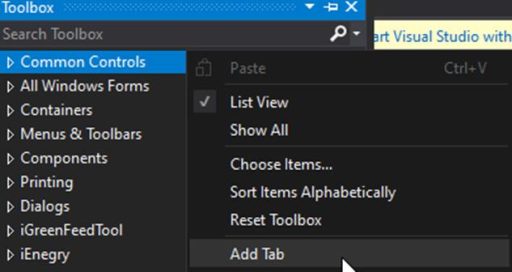
In the Toolbox interface, right-click and select Add Tab to add the ATSCADA iTools library.
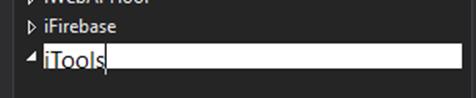
Enter the name ATSCADA iTools to easily identify this toolset.
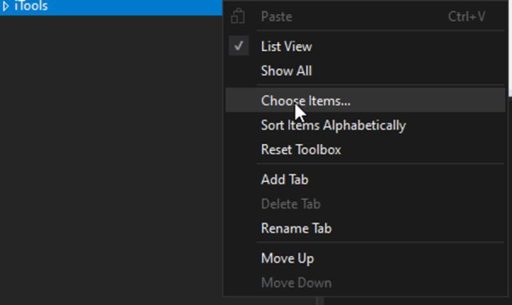
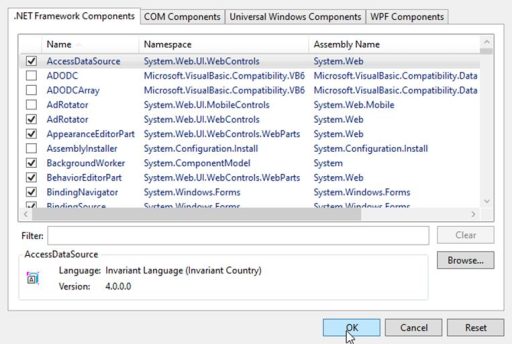
Then right-click on the newly created iTools tab and select Choose Items:
Select Browser to proceed to choose the correct library:
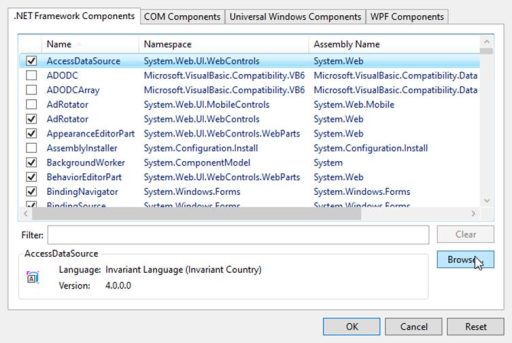
Select the ATSCADA iTools.dll library from the following path:
C:\Program Files\ATPro\ATSCADA\
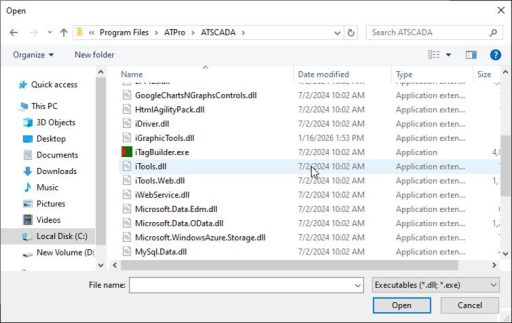
After making your selection, click OK to add the iTools library:
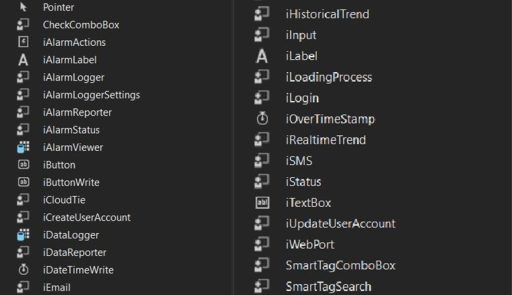
After the installation is completed, the ATSCADA iTools tab will display a list of components used for data handling and system operations.
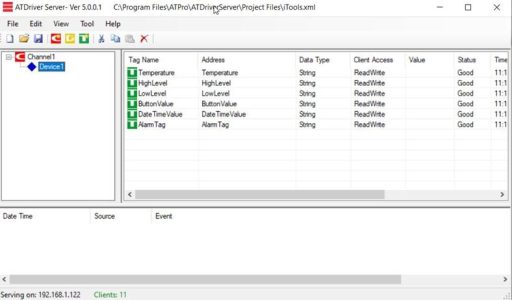
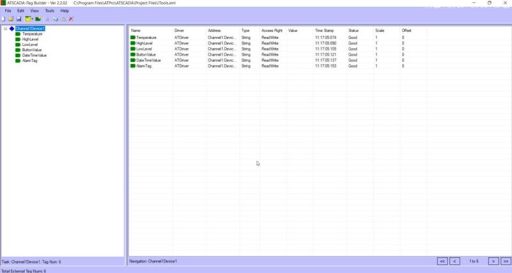
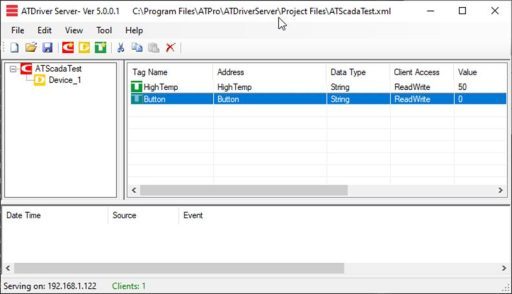
Step 2: Configure ATDriver Server (Create Data Tags)
This is a critical step to create the data source used by ATSCADA iTools calculation tools.
- Open ATDriver Server and go to File > New.
- Add Channel: Set the name to Channel1 and choose the driver InternalMemory.all.dll.
- Add Device: Set the device name to Device 1.
- Create the following Tag (Data Type: String/Double):
- HighTemp: High temperature threshold.
- Go to File > Save As and save the configuration file as iTools.xml.
Step 3: Configure iTagBuilder for ATSCADA iTools
- Open iTagBuilder and select New > Yes.
- In Driver Name, enter ATDriver. Click Add Driver and select the file ATDriverClient.dll.
- Enter the IP address of the computer running Driver Server (for example: 192.168.1.122) or keep the default localhost. Then click Connect.
- Go to Tools > Import All, select the device, and click OK.
- Go to File > Project Register, save the project file, and click Yes to register the tags into the ATSCADA iTools system.
Detailed Guide to ATSCADA iTools Components
Important Note: Always drag the iDriver component onto the screen first before using any other ATSCADA iTools tools. The ATSCADA iDriver manages communication, real-time tag exchange, and data connectivity across the system.
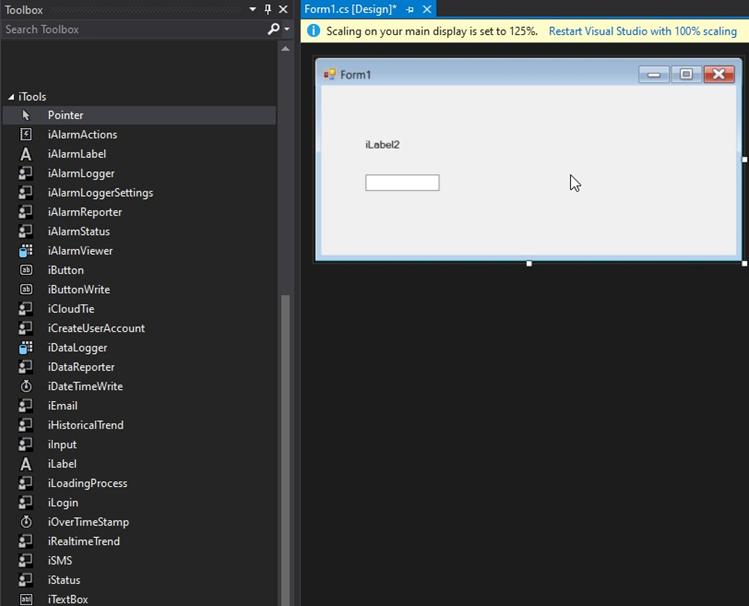
1. iLabel
- This group is used to display and input real-time values from external devices in ATSCADA iTools.
- Description: Drag iLabel onto the Form.
- Properties Settings:
- Driver: Select iDriver1.
- TagName: Select the Tag that will display the required information.
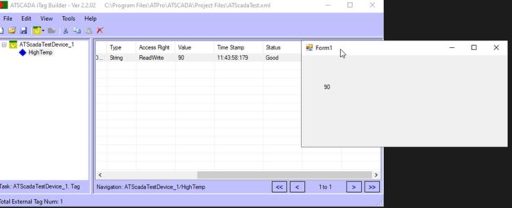
- Upon successful execution, the value of the Tag will be displayed:
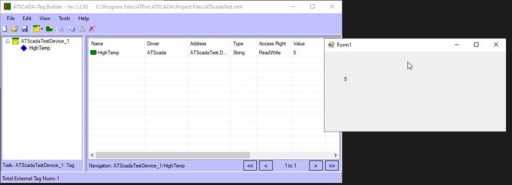
- Try changing the Tag value using iTagBuilder
If the value is not displayed and only the component name such as iLabel appears, the Tag status is BAD or NULL, meaning the data cannot be read.
2. iTextBox, iButton, and iInput
This group in ATSCADA iTools is used to display and input real-time values from external devices.
- Description: Drag iTextBox, iButton, and iInput onto the Form.
- Properties Settings:
- Driver: Select iDriver1.
- TagName: Select the Tag that will display the required information.
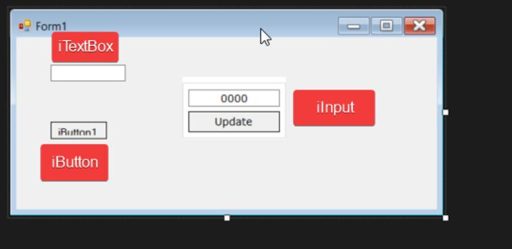
a. iTextBox: Configuration is similar to iLabel; select the Driver and assign a TagName.
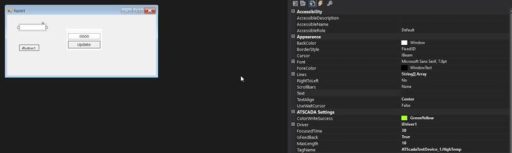
Here, there is one additional property called ColorWriteSuccess, which indicates a successful write operation in ATSCADA iTools.
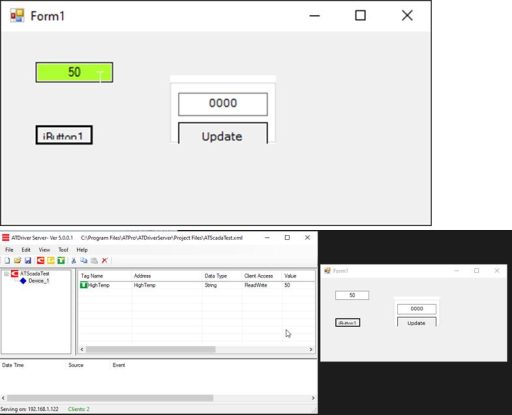
Write a test value to the HighTemp Tag in ATDriver Server.
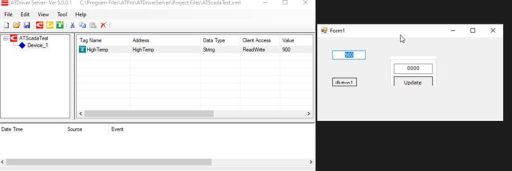
The display changes to the color defined in the ColorWriteSuccess property, indicating that the data has been written successfully in ATSCADA iTools.
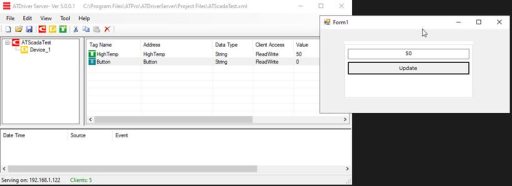
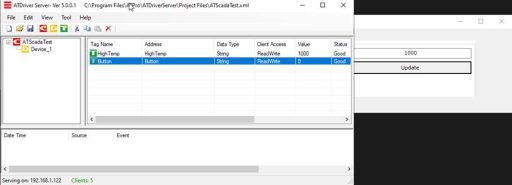
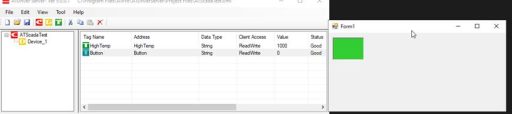
b. iButton: Configure the driver as in the previous steps, adding another tag named Button for demonstration purposes.
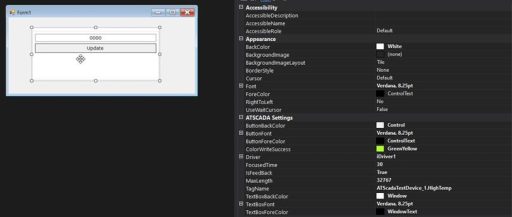
In the Properties section of iButton, under TagName:
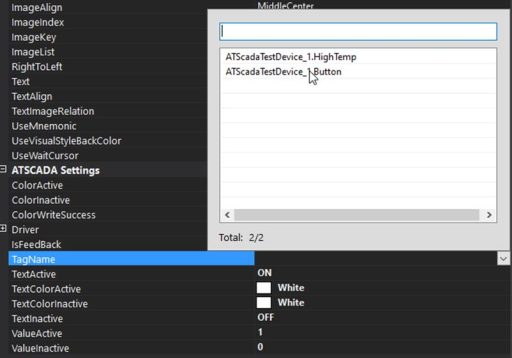
Select the newly created Button Tag in ATSCADA iTools.
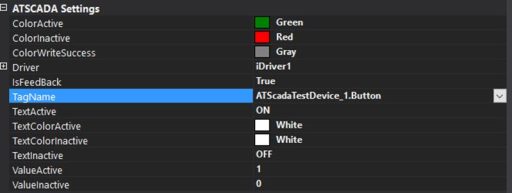
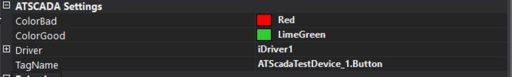
Here we configure the Settings as follows:
The Tag value equals ValueActive, the component will display the ColorActive color. When the Tag value equals ValueInActive, it will display the ColorInActive color.
When interacting with the Button, the ColorWriteSuccess color will appear to indicate that the value has been written successfully in ATSCADA iTools.
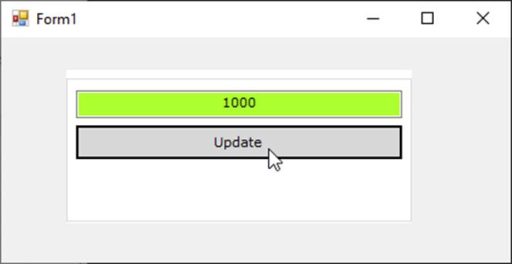
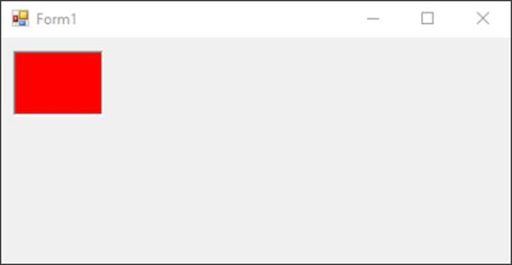
Example:
The value of the newly created Button Tag is currently 0, which matches ValueInActive, so it will display the ColorInActive color, which is red.
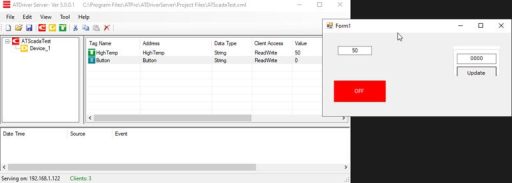
Click this button to switch the value in ATSCADA iTools
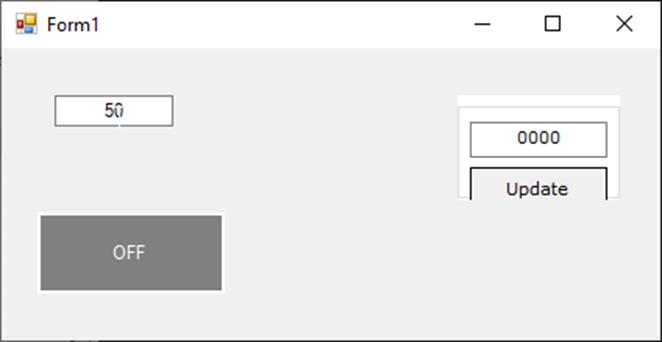
The Button changes to gray, representing the ColorWriteSuccess color, which indicates the value has been written successfully in ATSCADA iTools.
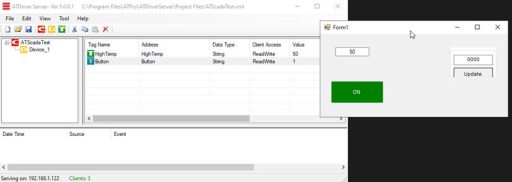
At this point, the value of the Button Tag has changed to 1, which matches ValueActive, so it will display the ColorActive color, which is green.
3. iInput
The iInput component in ATSCADA iTools works similarly to iTextBox, allowing users to write values directly to a Tag.
Write the value down using input:
The component displays the ColorWriteSuccess color, indicating that the value has been written successfully in ATSCADA iTools.
Result:
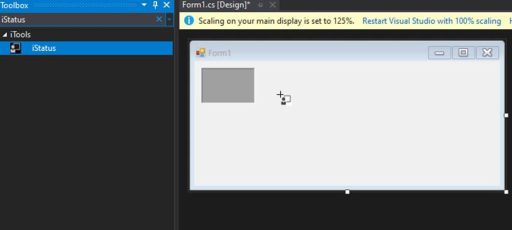
- iStatus: Used in ATSCADA iTools to display system operating status or messages on the status bar.
Example: Drag the iStatus component onto the Form.
Component Settings Configuration:
Here, the component checks the STATUS column of the Tag in ATDriver Server. If the status is Bad, it will display the configured warning color. If the status is Good, it will display the assigned normal color based on the settings.
In this case, the Tag status is Good, so it appears in green in ATSCADA iTools.
To simulate a Bad Tag status, you can turn off ATDriver Server or disconnect the sensor. The component will immediately switch to red in ATSCADA iTools.
iDataLogger
The iDataLogger component in ATSCADA iTools is used to store TagName data into a database for easier management and historical data tracking.
- Description: Drag iDataLogger onto the Form.
Properties Settings:
- Driver: Select iDriver1.
- DatabaseLog: Database information including DB Name, Table Name, and related settings.
- LoggingTimeRate: The interval for saving values, measured in milliseconds. You can assign a TagName or enter a direct value inside quotation marks.
- UpdateType:
- Timer: Save data based on the LoggingTimeRate interval.
- Event: Save data when a TagName in the Collection has a Trigger assigned and its value changes.
- All: Save data using both methods above.
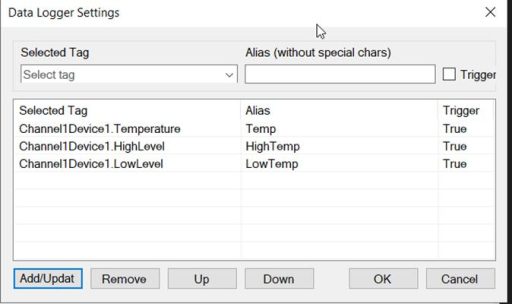
- Collection:
- Selected Tag: Choose the TagName to log.
- Alias: Assign a user-friendly label.
- Trigger: Used to mark lower threshold colors.
- LineColor: Set the display color for the assigned TagName.
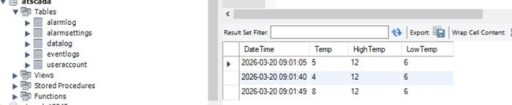
- Result: When running the test, the data was logged to the database using the previously set up Datalog table.
iDataReporter
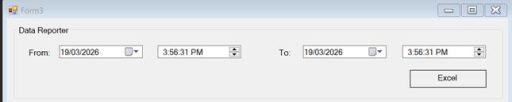
The iDataReporter component in ATSCADA iTools is used to export data to an Excel file based on the records previously stored by iDataLogger.
- Description: Drag iDataReporter onto the Form.
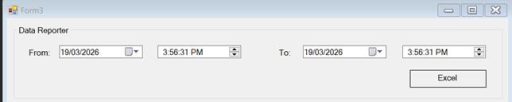
Properties Settings:
- Driver: Select iDriver1.
- DatabaseLog: Enter the database information including DB Name and Table Name for exporting data.
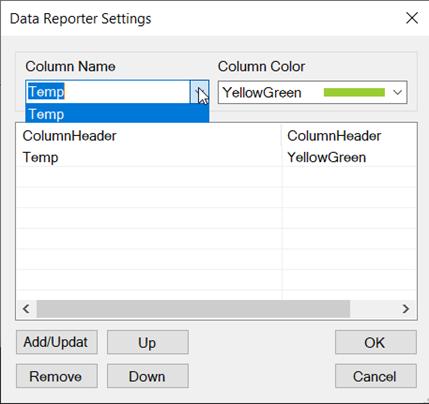
- ColumnSettings:
- Column Name: Select the data column previously stored by iDataLogger.
- Column Color: Set the color for the exported report in ATSCADA iTools.
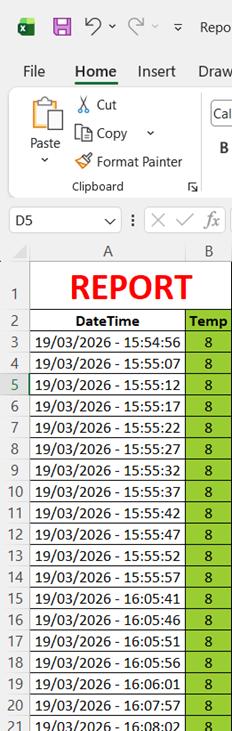
• Result:
iAlarmLogger
The iAlarmLogger component in ATSCADA iTools is used to store alarm event data into a database.
- Description: Drag iAlarmLogger onto the Form.
Properties Settings:
- Driver: Select iDriver1.
- DatabaseLog: Enter the database information including DB Name and Table Name for alarm logging.
- EmailTagName: Configure email settings to send alert notifications when an alarm occurs.
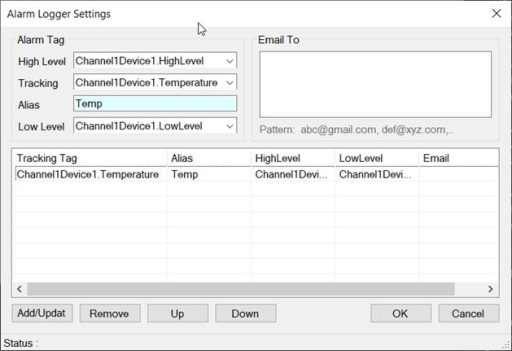
Collection:
- High Level: Set the high threshold value. You can select a TagName or enter a direct value in quotation marks.
- Low Level: Set the low threshold value. You can select a TagName or enter a direct value in quotation marks.
- Tracking: Select the TagName used for comparison with the High Level and Low Level thresholds.
- Alias: Assign a clear and user-friendly label in ATSCADA iTools.
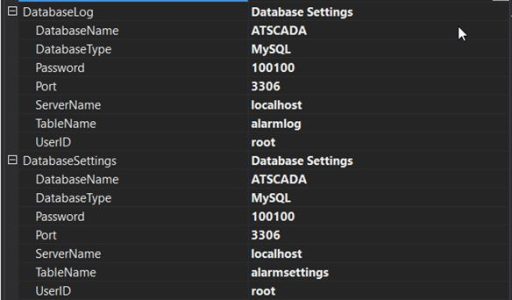
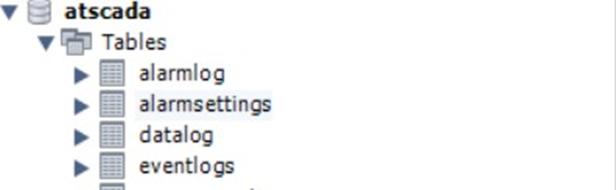
• Results: After setup and testing, check the database; tables such as alarmlog and alarmsettings should be present.
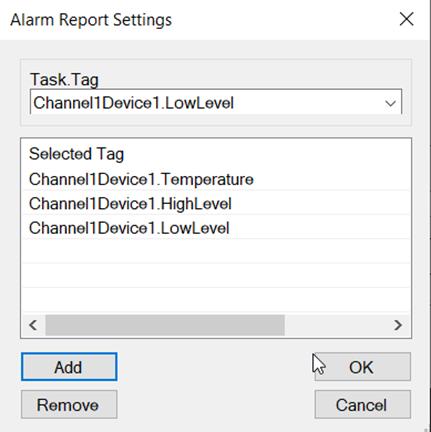
The setup data for the Properties Collection will be saved in alarm settings:
![]()
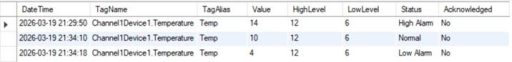
When the value exceeds the high threshold or drops below the low threshold, the data will be stored in the alarmlog table in ATSCADA iTools.
Set up a sample value for testing.
![]()
Increase the value of the Tracking TagName to 14 to simulate a high-limit alarm, then reduce it to 10 to return to normal status, and finally lower it to 4 to simulate a low-limit alarm in ATSCADA iTools.![]()
The data is logged into the alarmlog table in the database by ATSCADA iTools.
iAlarmReporter
The ATSCADA iTools iAlarmReporter component exports alarm data to an Excel file using records previously stored by iAlarmLogger.
- Description: Drag iAlarmReporter onto the Form.
Properties Settings:
- Driver: Select iDriver1.
- DatabaseLog: Enter the database information including DB Name and Table Name for exporting alarm data.
- ColumnSettings:
- Task.Tag: Select the TagName data column to include in the report.
- Column Color: Set the report export color in ATSCADA iTools.
Result :
iRealTimeTrend
Create a new ATDriver Server file with the following Tags (Data Type: String/Double):
- Temperature: Temperature value.
- HighLevel: Machine status.
- LowLevel: Motor status.
- MotorOnTime: Machine running time.
- MotorOffTime: Machine stopped time.
- TotalTime: Total operating time.
- Efficiency, Availability, Performance, Quality, Utilization: LEAN performance indicators.
- TotalPieces: Total products.
- GoodPieces: Accepted products.
- CSTK: Designed capacity.

The iRealTimeTrend component in ATSCADA iTools displays live data in chart form.. It supports two chart types: Line Chart and Bar Chart.
- Description: Drag iRealTimeTrend onto the Form.
Properties Settings:
- Driver: Select iDriver1.
- Collection:
- Name: Select the TagName to display.
- Alias: Assign a clear and user-friendly label.
- FillColor: It is recommended to set this to Transparent to avoid covering lower chart lines.
- LineColor: Set the color for the assigned TagName in ATSCADA iTools.

Result :
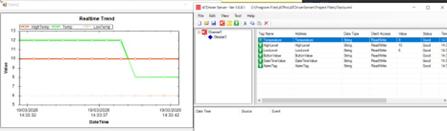
iHistoricalTrend
The ATSCADA iTools iHistoricalTrend component displays historical data in chart form. It supports two chart types: Line Chart and Bar Chart.
- Description: Drag iHistoricalTrend onto the Form.
Properties Settings:
- Driver: Select iDriver1.
- AddTag:
- Name: Select the TagName to display.
- Alias: Assign a clear and user-friendly label.
- FillColor: It is recommended to set this to Transparent to avoid covering lower chart lines.
- LineColor: Set the color for the assigned TagName in ATSCADA iTools.
👉 Learn More about ATSCADA Software

ATSCADA - Smart SCADA Software with AI Predictor & Blockchain. ATSCADA is an advanced SCADA software platform for real-time monitoring, intelligent control, and efficient data acquisition. It is ideal for Industrial IoT (IIoT), smart cities, integrated automation systems, and Agriculture 4.0. With a built-in AI Predictor, ATSCADA enables predictive analytics to detect issues early, optimize performance, and reduce downtime. The integration of Blockchain technology ensures secure, transparent, and tamper-proof data management. Highly scalable and easy to integrate, ATSCADA is trusted by businesses to enhance productivity, strengthen cybersecurity, and accelerate digital transformation.
Related articles
ATSCADA iStreamCameraTools – Industrial IP Camera Integration and Real-Time Video Monitoring
The iStreamCameraTools toolkit enables the connection of ONVIF-compatible cameras to receive camera streams and display [...]
Jun
OPC Server Connection Guide
Overview The ATSCADA ecosystem provides exceptional flexibility for integrating data from third-party OPC Servers (such [...]
Jun
Common ATSCADA Errors and How to Fix Them – FAQ for ATSCADA Tools and Systems
Issues Related to ATDriverServer & iTagBuilder Software Why Does ATDriverServer Not Open? There are two [...]
May
ATSCADA Hospital Temperature and Humidity Monitoring Alarm System Project
Requirements: The system includes three monitoring areas: the pharmacy, inpatient warehouse, and cold storage, following [...]
May
ATSCADA CookBook: Complete Guide to System Architecture, Tools, Installation & Troubleshooting
The ATSCADA Training book is an essential navigation structure that helps users access all major [...]
Apr
ATSCADA Power Management System
Requirements: There are 3 areas that require power management, including a factory, a residential zone, [...]
Apr