
SCADA Software
iGaugeLiveChart in ATSCADA: Real-Time Live Chart Monitoring and Visualization System
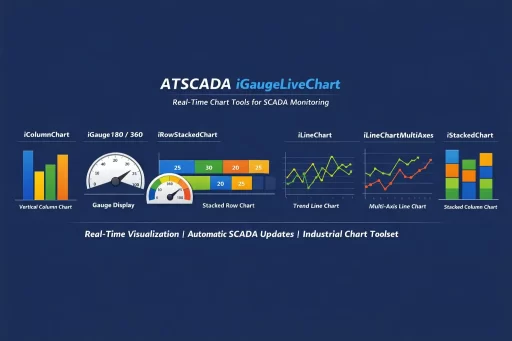
ATSCADA iGaugeLiveChart is a real-time chart visualization toolkit designed for the ATSCADA platform. Built with the powerful LiveCharts library, this toolset automatically updates chart values whenever SCADA tags change, providing accurate and responsive real-time monitoring for industrial automation systems.
The toolkit supports multiple chart types including column charts, stacked row charts, line charts, multi-axis charts, stacked column charts, and gauge displays. It is ideal for factories, power plants, water treatment systems, manufacturing lines, and other industrial environments that require live data visualization.
iColumnChart – Real-Time Vertical Column Chart
iColumnChart displays SCADA tag values in a vertical column chart format. Each SCADA tag is represented as an individual column, and values refresh automatically whenever the tag changes.
Key Features:
- Separate column for each SCADA tag
- Real-time automatic updates
- Easy comparison of multiple values
- Clean and intuitive chart layout
Properties:
- Driver: Select iDriver 1
- Collection: Data point list configured through the editor window
- BackGroundColor: Background color of the chart
- ColorAxisXY: Text color for X and Y axes
iGauge180 – Real-Time Gauge Display (180° / 360°)
iGauge180 shows a single SCADA tag value using a semi-circle gauge (180°) or a full-circle gauge (360°), with advanced dashboard options available through ATSCADA iGauge DevExpress. Values update in real time and are rounded to two decimal places.
Key Features:
- Supports 180° and 360° display modes
- Smooth real-time value updates
- Ideal for pressure, temperature, speed, and level monitoring
Properties:
- Driver: Select iDriver 1
- MinValue: Minimum value (default: 0)
- MaxValue: Maximum value (default: 100)
- Use360:
true= 360° mode,false= 180° mode - GaugeValue: Current live value from SCADA tag
- RadiusGauge: Inner gauge radius (default: 70)
iRowStackedChart – Horizontal Stacked Row Chart
iRowStackedChart displays multiple SCADA tag values as a horizontal stacked row chart. Values are stacked over time and keep a maximum of the latest four samples.
Key Features:
- Horizontal stacked visualization
- Shows recent historical values
- Labels displayed on each stacked segment
Properties:
- Driver: Select iDriver 1
- Collection: Data point list configured in editor
- ColorAxisXY: Background color of the chart
iLineChart – Real-Time Trend Line Chart
iLineChart displays multiple SCADA tag values over time using a line chart. The data scrolls continuously, while the X-axis represents time.
Key Features:
- Continuous real-time trending
- Time-based monitoring
- Suitable for process analysis and historical trends
Properties:
- Driver: Select iDriver 1
- Collection: Data point list configured in editor
- ColorAxisXY: Background color of the chart
- SampleQuantity: Maximum number of displayed samples (default: 100)

iLineChartMultiAxes – Multi-Axis Line Chart
iLineChartMultiAxes works like iLineChart but provides a separate Y-axis for each data series. The first Y-axis appears on the left, while the others are displayed on the right.
This tool is ideal when monitoring SCADA tags with different units or measurement ranges.
Key Features:
- Independent Y-axis for each series
- Supports mixed engineering units
- Better readability for complex systems
Properties:
- Driver: Select iDriver 1
- Collection: Data point list configured in editor
- ColorAxisXY: Text color for X and Y axes
- SampleQuantity: Maximum displayed samples (default: 100)
iStackedChart – Vertical Stacked Column Chart
iStackedChart displays multiple SCADA tag values as a stacked vertical column chart. Values are stacked over time and keep up to the latest four samples.
Key Features:
- Vertical stacked layout
- Historical sample comparison
- Value labels on each stacked section
Properties:
- Driver: Select iDriver 1
- Collection: Data point list configured in editor
- ColorAxisXY: Text color for X and Y axes
Why Choose ATSCADA iGaugeLiveChart?
Using ATSCADA iGaugeLiveChart helps engineers and operators monitor live production data more effectively. With automatic SCADA tag updates and multiple chart styles, users can quickly identify trends, compare values, and respond to system changes instantly.
Benefits:
- Real-time SCADA visualization
- Fast response to changing process values
- Easy dashboard integration with ATSCADA graphic tools for SCADA design visualization
- Multiple industrial chart types
- Improved decision-making and control
Conclusion

ATSCADA - Smart SCADA Software with AI Predictor & Blockchain. ATSCADA is an advanced SCADA software platform for real-time monitoring, intelligent control, and efficient data acquisition. It is ideal for Industrial IoT (IIoT), smart cities, integrated automation systems, and Agriculture 4.0. With a built-in AI Predictor, ATSCADA enables predictive analytics to detect issues early, optimize performance, and reduce downtime. The integration of Blockchain technology ensures secure, transparent, and tamper-proof data management. Highly scalable and easy to integrate, ATSCADA is trusted by businesses to enhance productivity, strengthen cybersecurity, and accelerate digital transformation.
Related articles
ATSCADA iStreamCameraTools – Industrial IP Camera Integration and Real-Time Video Monitoring
The iStreamCameraTools toolkit enables the connection of ONVIF-compatible cameras to receive camera streams and display [...]
Jun
OPC Server Connection Guide
Overview The ATSCADA ecosystem provides exceptional flexibility for integrating data from third-party OPC Servers (such [...]
Jun
Common ATSCADA Errors and How to Fix Them – FAQ for ATSCADA Tools and Systems
Issues Related to ATDriverServer & iTagBuilder Software Why Does ATDriverServer Not Open? There are two [...]
May
ATSCADA Hospital Temperature and Humidity Monitoring Alarm System Project
Requirements: The system includes three monitoring areas: the pharmacy, inpatient warehouse, and cold storage, following [...]
May
ATSCADA CookBook: Complete Guide to System Architecture, Tools, Installation & Troubleshooting
The ATSCADA Training book is an essential navigation structure that helps users access all major [...]
Apr
ATSCADA Power Management System
Requirements: There are 3 areas that require power management, including a factory, a residential zone, [...]
Apr